Nobody Signed Off on the AI Bill
The invoice shows up at the end of the month. It’s bigger than last month. It was bigger than last month, last month too. Someone forwards it to you with three words: “Is this right?”
And here’s the uncomfortable part - you don’t actually know. You know the number is real. You know it came from LLM usage. Beyond that, the honest answer is a shrug. Which teams drove it? Which application? Was it the customer-facing product doing real work, or a forgotten batch job hammering the most expensive model in the catalog at 3 a.m.? Is one team quietly subsidizing another? You can’t say, because the bill arrives as a single lump sum from each provider, with no idea of who inside your own company generated it.
This is the shadow AI problem, and it’s not really about shadow tools. It’s about shadow spend. Your engineers adopted AI faster than your finance and governance functions could catch up, and now you’re paying for something you can’t see inside of.
The reason you’re flying blind
A raw LLM provider bill is aggregated at exactly the wrong level. It tells you “you spent this much on this vendor.” It tells you nothing about the dimensions that matter to a business: which cost center, which team, which project, which environment, which application, which model.
The provider has no idea your org has a “data-science” team or a “support” cost center. Why would it? Those are your concepts. So the moment usage leaves your building, all of that context is stripped away, and you’re left reconstructing it after the fact from spreadsheets and guesswork.
The fix isn’t a better spreadsheet. The fix is to capture that context at the moment each request is made - while you still know who’s asking and why - instead of trying to reverse-engineer it from an invoice weeks later.
Every request, tagged at the door
This is what changes when LLM traffic flows through a gateway instead of going straight to the provider. Every single request passes through one controlled point on its way out, and at that point you can attach business context to it — what the platform calls dimensions.
Think of dimensions as the labels that describe who and what is behind a request: the organization, the cost center, the group or team, the individual user, the virtual key that was used, the provider, the model, and the model family. Some of these the gateway knows natively (it can see the model and the provider on every request). Others you define once to match how your business is actually organized - your cost centers, your team names, your org structure.
The result: spend stops being one number and becomes a dataset you can slice. Not next month. Live.
What “I can finally see it” looks like
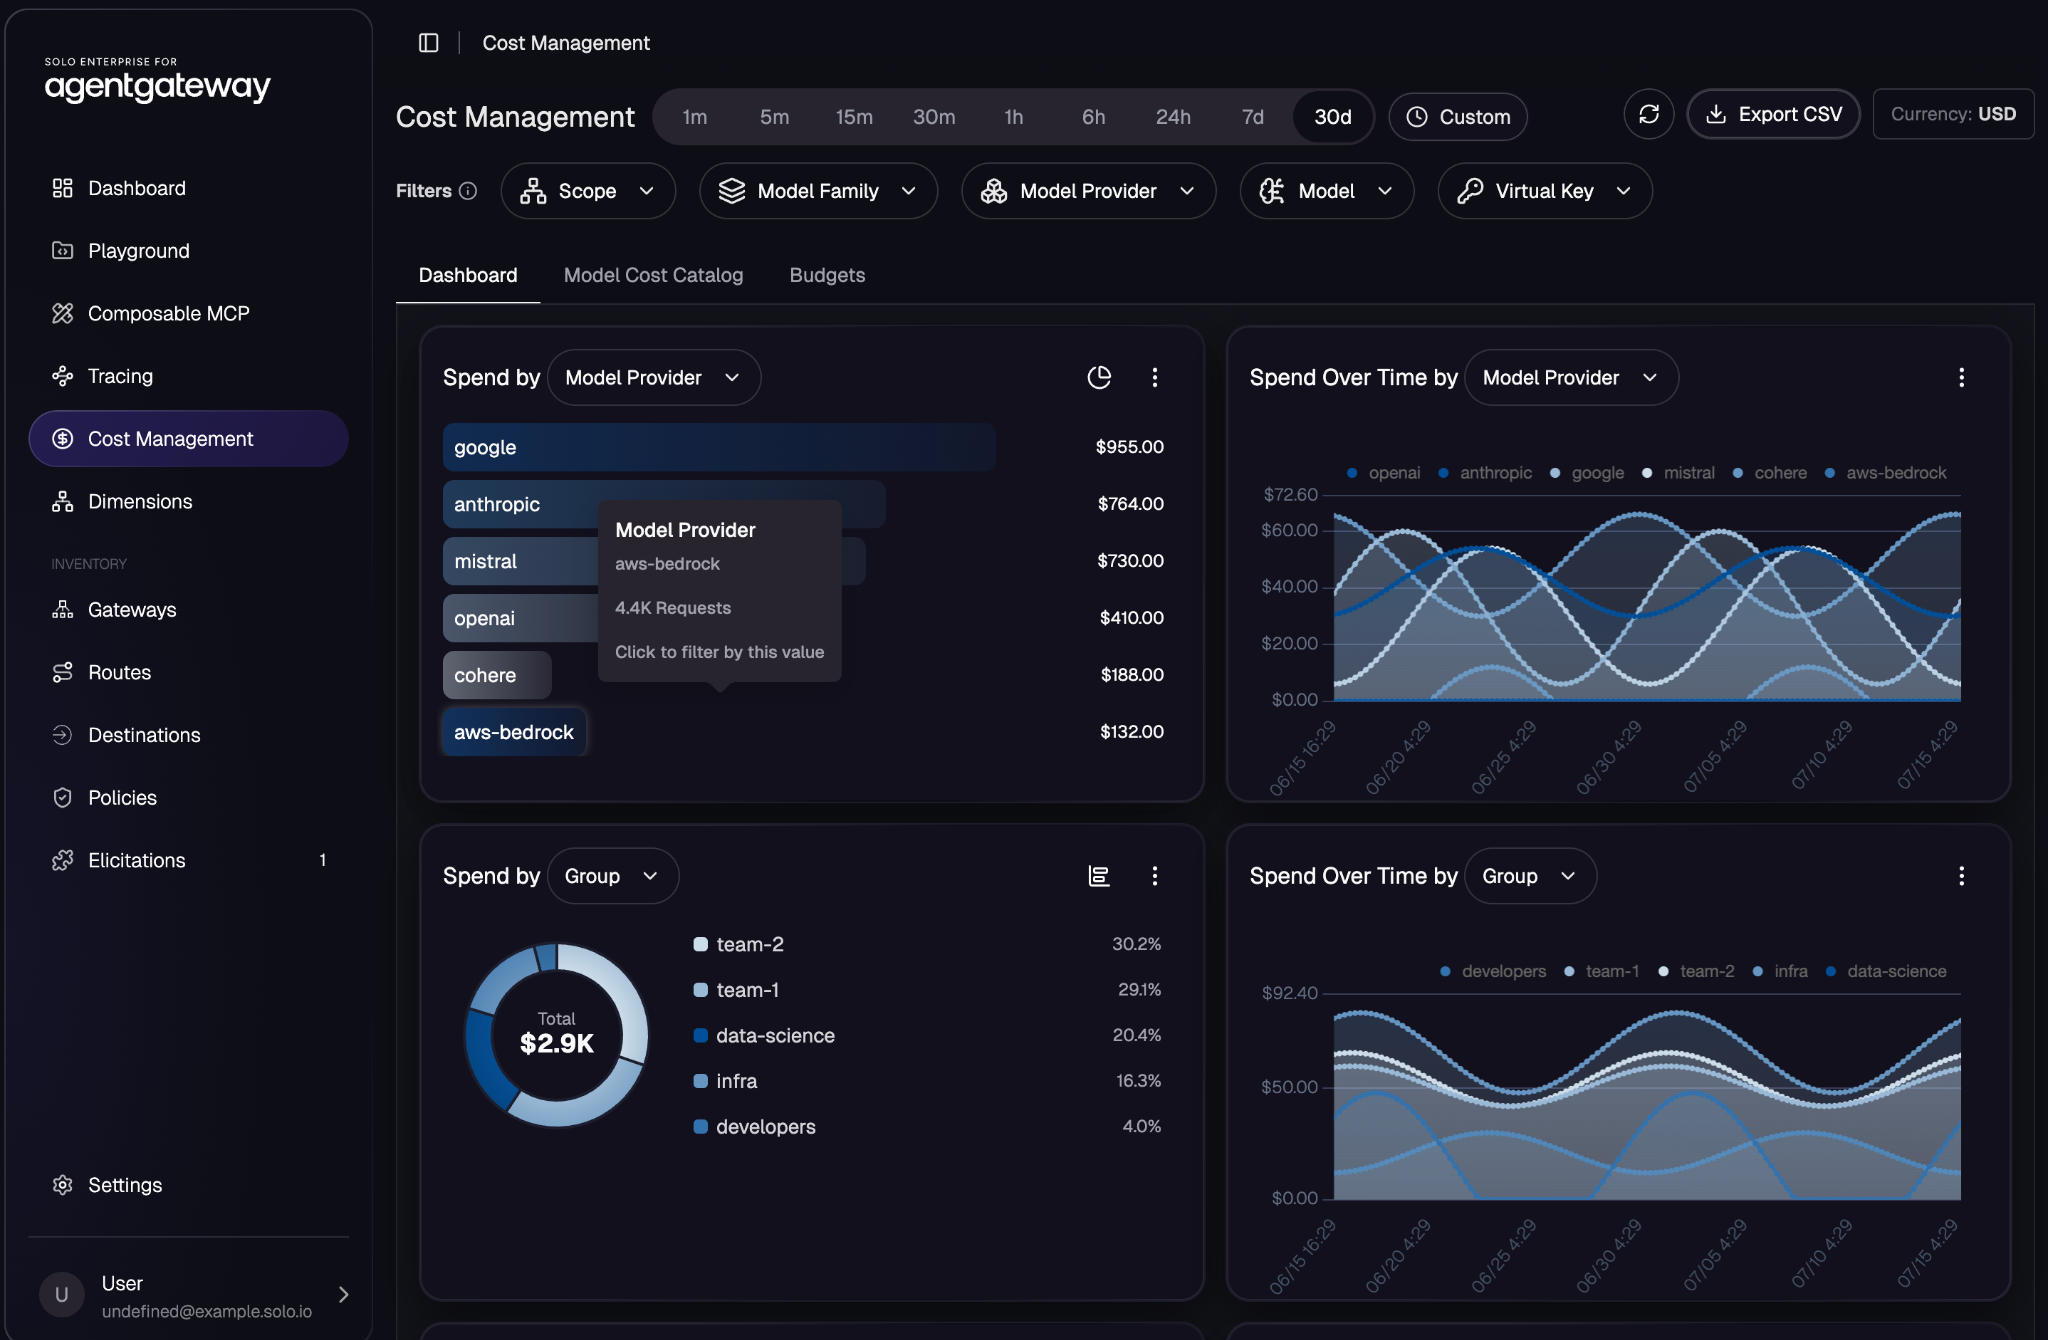
Open the Cost Management view and the fog lifts. Total spend is right there at the top. Underneath, it’s broken down the way you actually think about the business.
Spend by provider shows you the vendor split at a glance - how much is going to Google versus Anthropic versus OpenAI versus the rest. Useful the first time you look at it, and genuinely valuable when you’re negotiating a contract or deciding where to consolidate.
Spend by group is the one that tends to stop executives mid-sentence. A clean donut chart: this team is 30% of the bill, that team is 29%, data science is 20%, infrastructure is 16%, and one team you assumed was a heavy user is actually 4%. Suddenly the conversation about the AI budget is a conversation about specific teams and specific choices, not a mystery.
Spend over time turns the static bill into a trend. You can see the ramp. You can see the spike on the day someone shipped a feature. You can see whether a cost-control change you made two weeks ago actually bent the curve.
And all of it moves through the same time controls - the last five minutes, the last hour, the last thirty days, or a custom range - so the same view serves both the “what’s happening right now” question and the “how did the quarter go” question.
Filters: from “the whole bill” to “that one thing”
Seeing the breakdown is step one. Being able to interrogate it is step two, and this is where the dimensions pay off a second time.
The same labels that get attached to every request become filters across the top of the dashboard: scope, model family, model provider, model, virtual key. Click into any of them and the entire view narrows to just that slice.
Want to know what a single team spent on a single provider last week? Two clicks. Want to see which model family is eating the data-science budget? Filter to the group, then look at the model breakdown. Want to check whether a specific application - tagged by its virtual key - is behaving? Filter to it and watch its trend line.
This is the difference between a report and a tool. A report tells you what happened. A tool lets you ask the next question, and the one after that, until you actually understand what’s going on. When the CFO asks “why did AI spend jump 40% in March,” you don’t schedule a week of analysis. You answer in the meeting.
The quiet superpower: chargeback becomes possible
Here’s the strategic payoff that most people don’t see coming until they have the data in hand.
Once every dollar of AI spend is attributed to a cost center, a team, and a project, you can do something you almost certainly can’t do today: charge it back. The AI bill stops being a central, un-owned line item that platform or IT absorbs, and becomes each team’s own number, on each team’s own budget, that each team’s own leader has to defend.
That single shift changes behavior more than any policy memo ever will. When a team can see that their choice of model is costing them real money against their own budget, they right-size it themselves. When spend is anonymous and centrally absorbed, nobody optimizes anything — because why would they? Attribution isn’t just an accounting nicety. It’s the mechanism that aligns the people making the requests with the cost of making them.
Who, what, how much
Strip away the dashboards and the charts and this is the whole story: you went from an invoice you couldn’t explain to being able to answer, at any moment, who is spending, what they’re spending it on, and how much.
That’s the foundation. It’s not the finish line - knowing where the money goes is different from controlling it, and “we can see it” is a very different sentence from “we can stop it.” That’s the next problem, and it’s a good one to have, because you can only govern what you can measure.
You just started measuring.



%20(1).png)












%20a%20Bad%20Idea.png)