How do you know that the action an agent performed did as well as expected? Did it hallucinate a workflow and therefore the output? Was it performant? Did it follow safety best practices that all agents should abide by? Organizations have heard the whole "hallucination from LLMs" bit and various other issues with agentic output, so having a tool that can evaluate what actually happens is within an agent run key.
That's where a new concept from Anthropic, agentic evaluations, comes into play.
In this blog post, you'll learn about agentevals and how to use/implement a tool that you can use to run AI evaluations across any agent workflow.
Prequisites
To follow along with this blog post, you should have the following:
- A k8s cluster. This can be a cluster running anywhere, even locally.
- kagent installed, and you can find the instructions here.
If you don’t, that’s totally fine! You can still follow along from a theoretical perspective and implement the hands-on piece at a later time.
What Are Agentic Evaluations?
Tldr; a benchmark/end-to-end test to ensure that your agent did what it was supposed to do based on human instruction.
When you run an agent, you have zero idea what it's actually going to end up doing (hence the constant conversations around non-deterministic workflows). You can give it a close-to-perfect prompt, agent Skills for a tightly defined task, and use the best instructions possible (e.g- a CLAUDE.md file, AGENTS.md, etc.), but despite the effort that you put into perfecting the output, that still doesn't mean your agent is going to do what it's supposed to because there are far too many variables in an agent run. With evaluations (evals), you can take a trace (the end-to-end agent workflow) that already occurred or look at an agent running live to see what it did/does and how it did/does it. The trace can then be graded. For example, if the agent hallucinated 25% of the output, that means the grade may be lower than “perfect” as the agent did not do exactly what it was supposed to do. The purpose of an evaluation is to see how well your agent did the job you tasked it with.
Where Evals Need Assistance
Because of the non-deterministic nature of agentic workflows defined in the previous section, that means by definition, the evaluation set may not be the same every time. For example, you can run an agent three times and get three different results. That's why specifying what you want to evaluate and how you want to grade an agent workflow is so crucial. Example: if you run an eval and you care about latency, focus on latency. Run it 3-5 times and take an average. Don't worry about the other output, just focus on one key area of the overall evaluation.
Setting Up an agent
With the “why” of why you’d want to use agentevals defined, let's dive into the hands-on piece of evals. First things first - for you to get a trace to benchmark/grade, you need an agent. An agent that’s used, at a high level, will most likely look like the following:
- A set of specific tools that your agent uses based on the task it needs to perform. These tools typically come from an MCP Server.
- A gateway that’s specialized for both LLM, MCP, and agentic traffic.
- An agent setup and configured.
Because it's a fair amount of code and configuration to get all of the above up and running, instead of having a full page of code on this blog post, you can a sample configuration on GitHub that you can use.
Deploying agentevals
To deploy agentevals, there are two choices for installation:
- From source
- One-line installation
The one-line install is via a Python package:
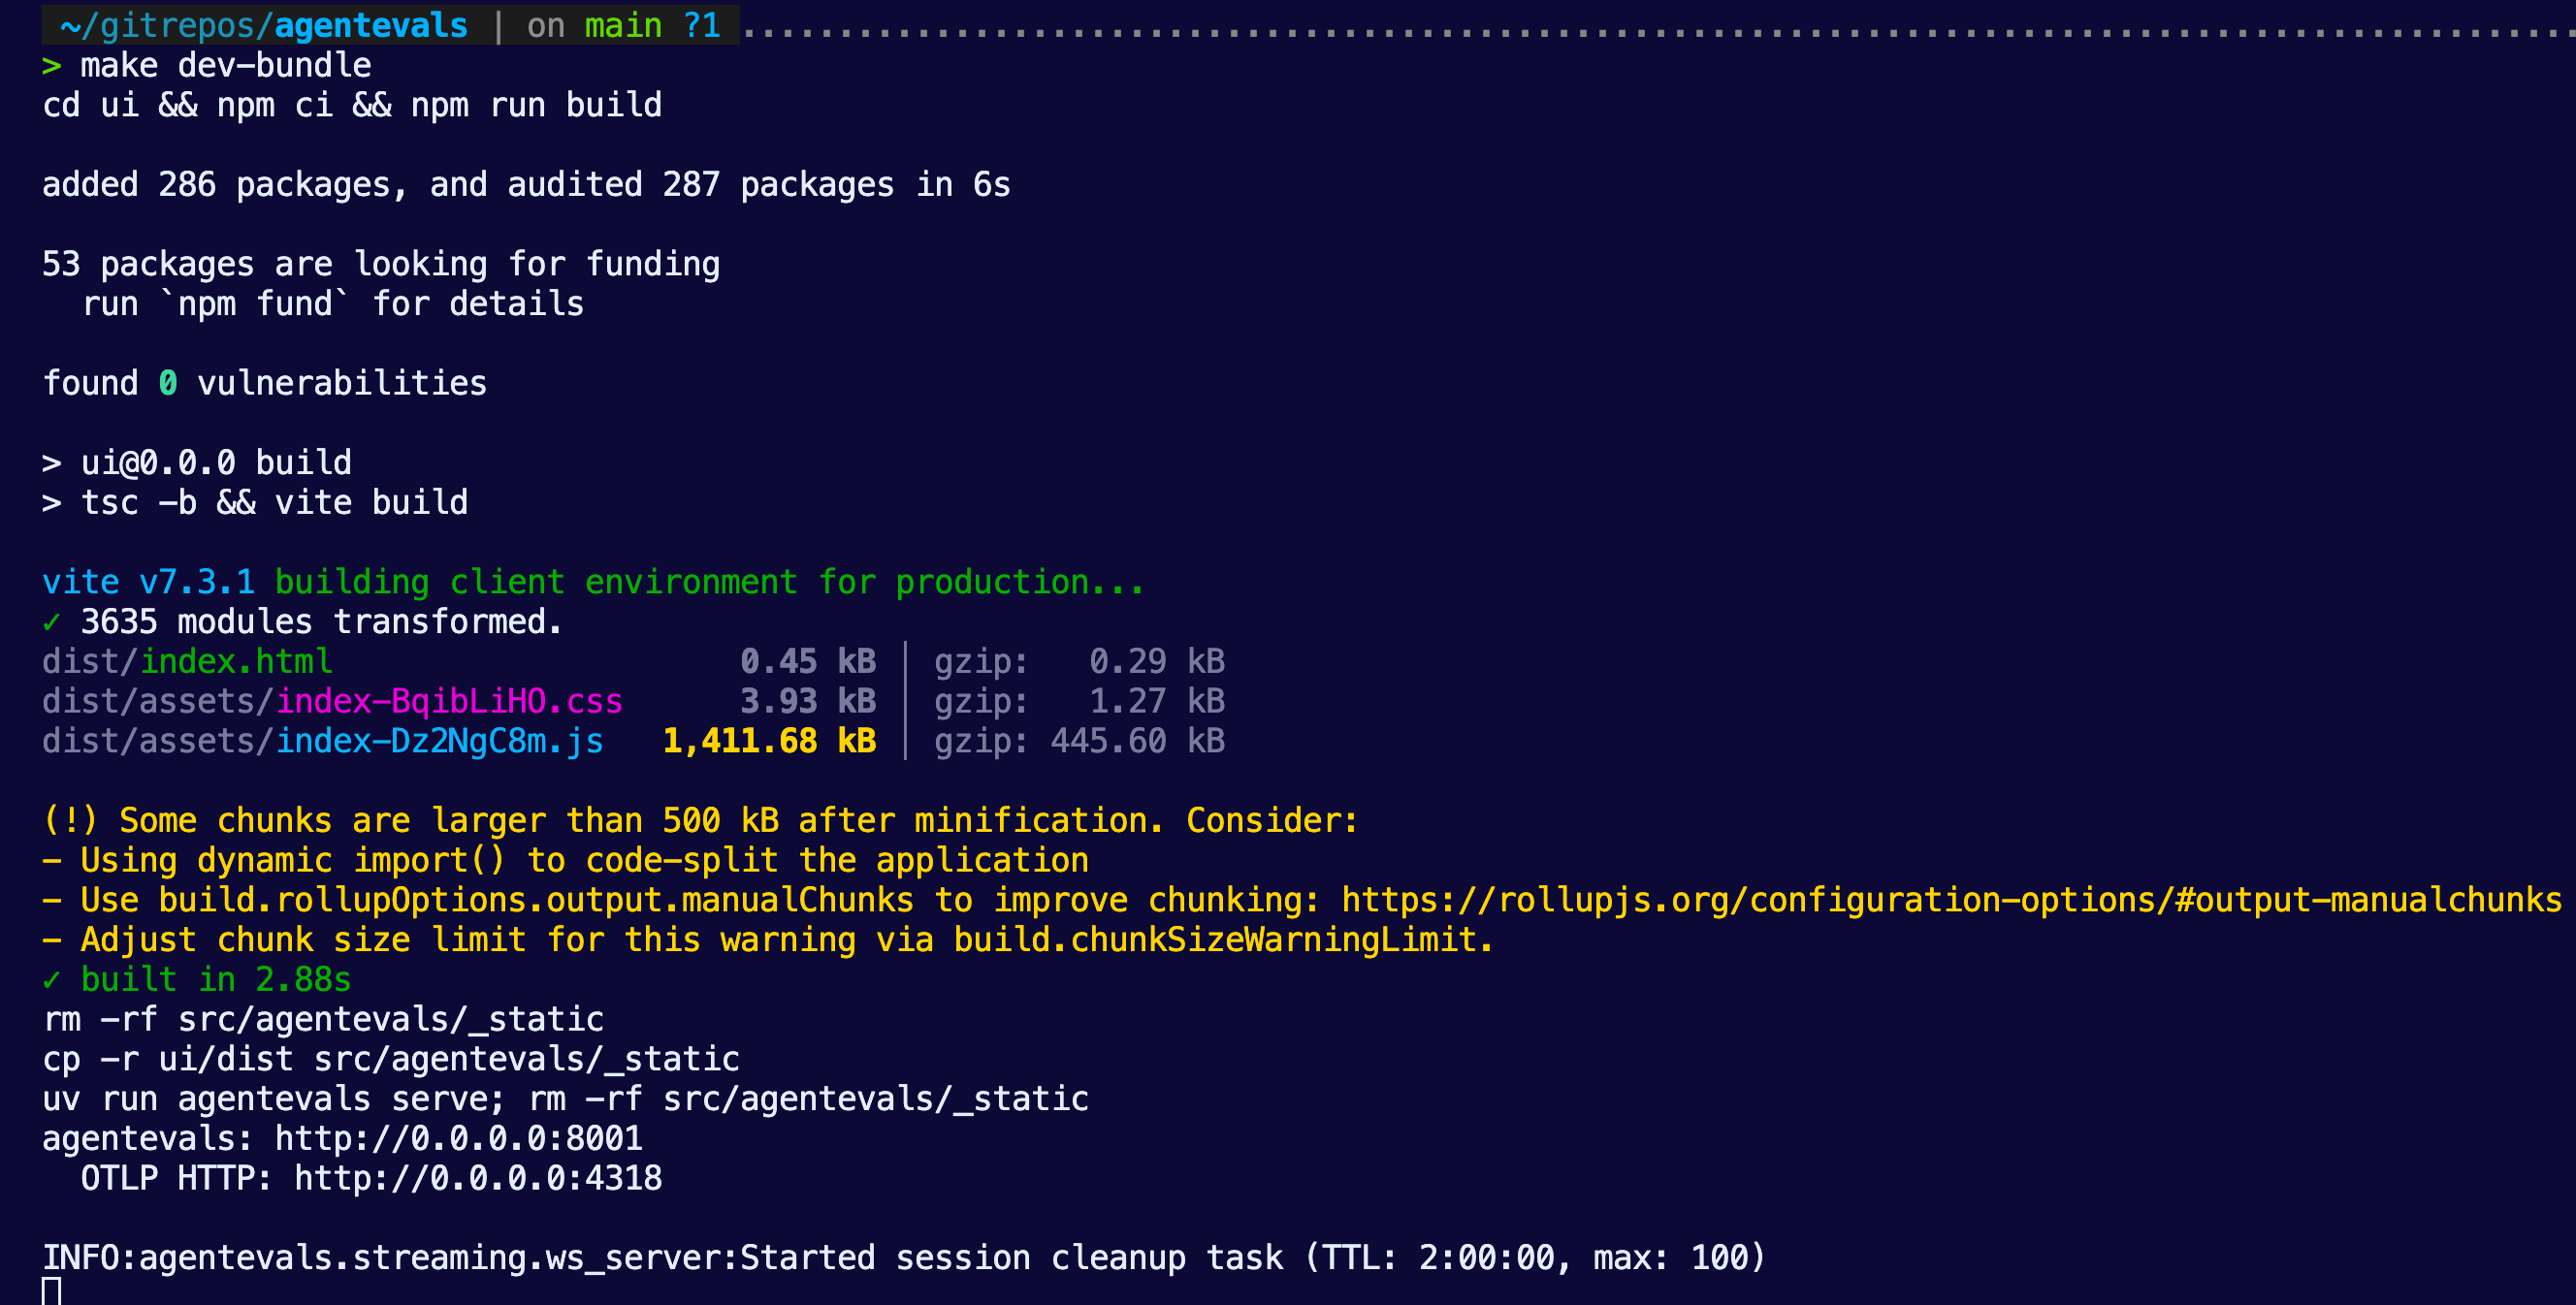
pip install agentevals-cliIf you decide to go with from source, you can clone the repo from here and then run:
make dev-bundleYou’ll then see agentevals running within your terminal.
Planning The Collection Of A Trace
The first step is to collect a trace. Luckily, the majority of agentic frameworks and AI gateways will expose traces. If you used kagent and agentgateway via the Setting Up an agent section, you'll definitely have traces available within your agent run.
- Ensure that you run your agent from the Setting Up an agent section after you get it created. That way, a trace is generated.
- Prompt Claude to collect traces for your agent that you ran in the previous section. Ensure that it knows agentevals can look at a trace via a JSON file and have it write a plan for you.
As an example, here's a plan that it came up with for me.
Here is Claude's plan:
╌╌╌╌╌╌╌╌╌╌╌╌╌╌╌╌╌╌╌╌╌╌╌╌╌╌╌╌╌╌╌╌╌╌╌╌╌╌╌╌╌╌╌╌╌╌╌╌╌╌╌╌╌╌╌╌╌╌╌╌╌
╌╌╌╌╌╌╌╌╌╌╌╌╌╌╌╌╌╌╌╌╌╌╌╌╌╌╌╌╌╌╌╌╌╌╌╌╌╌╌╌╌╌╌╌╌╌╌╌╌╌╌╌╌╌╌╌╌╌╌╌╌
╌╌╌╌╌╌╌╌╌╌╌╌╌╌╌╌╌╌╌╌╌╌╌╌╌╌╌╌╌╌╌╌╌╌╌╌╌
Plan: Export Gemini agent Traces from Kubernetes to Jaeger J
SON
What We Found
Cluster infrastructure:
- gemini-agent deployment in kagent namespace — a math-focus
ed agent using Gemini 3.1 Flash Lite with add and multiply MC
P tools
- OTel collector at solo-enterprise-telemetry-collector (por
ts 4317/4318)
- ClickHouse at kagent-mgmt-clickhouse-shard0-0 storing trac
es in otel_traces_json
- 4 trace IDs with 15 total spans for gemini_agent service
Traces available:agentic Quality Benchmarking With agent Evals4
┌─────────────┬───────┬─────────────────────────────────────
───────────────────────────────┐
│ TraceID │ Spans │ Content
│
├─────────────┼───────┼─────────────────────────────────────
───────────────────────────────┤
│ 5a2bfa1d... │ 2 │ invocation + invoke_agent only
│
├─────────────┼───────┼─────────────────────────────────────
───────────────────────────────┤
│ 27c4051f... │ 2 │ invocation + invoke_agent only
│
├─────────────┼───────┼─────────────────────────────────────
───────────────────────────────┤
│ a6fa589a... │ 4 │ Includes call_llm + openai.chat
│
├─────────────┼───────┼─────────────────────────────────────
───────────────────────────────┤
│ 2185c427... │ 7 │ Full flow: LLM call → tool add(2,2)
→ second LLM call (with error) │
└─────────────┴───────┴─────────────────────────────────────
───────────────────────────────┘
Target format: Jaeger JSON ({"data": [{"traceID": "...", "sp
ans": [...], "processes": {...}}]}) — matching existing sampl
es like samples/helm.json.
Implementation Plan
Step 1: Extract raw spans from ClickHouse
Run a ClickHouse query via kubectl exec to get all gemini_ag
ent spans as JSON:
kubectl exec -n kagent kagent-mgmt-clickhouse-shard0-0 -- cl
ickhouse-client \agentic Quality Benchmarking With agent Evals5
--query "SELECT ... FROM otel_traces_json WHERE ServiceNam
e = 'gemini_agent' FORMAT JSONEachRow"
Fields needed: TraceId, SpanId, ParentSpanId, SpanName, Span
Kind, ServiceName, ScopeName, ScopeVersion, Duration, StatusC
ode, StatusMessage, Timestamp,
SpanAttributes, ResourceAttributes, Events.*
Step 2: Convert ClickHouse rows to Jaeger JSON format
Write an inline Python script (no new file needed) that:
1. Reads the ClickHouse JSONEachRow output
2. Flattens nested SpanAttributes JSON objects to dot-separa
ted Jaeger tags
- e.g., {"gcp":{"vertex":{"agent":{"event_id":"..."}}}} →
{"key":"gcp.vertex.agent.event_id", "type":"string", "valu
e":"..."}
3. Adds otel.scope.name, otel.scope.version, and span.kind a
s tags (matching existing samples)
4. Converts timestamps: ClickHouse DateTime64(9) → epoch mic
roseconds
5. Converts duration: nanoseconds → microseconds
6. Builds references array from ParentSpanId (CHILD_OF ref t
ype)
7. Builds processes map from ResourceAttributes + ServiceNam
e
8. Converts Events to Jaeger logs array (timestamp + fields)
9. Groups spans by TraceId into the data array
10. Writes output to file
Step 3: Save the JSON file
Output location: samples/gemini_agent.json in the agentevals
repo (consistent with existing sample naming: helm.json, k8s.
json).agentic Quality Benchmarking With agent Evals6
Key Files
- Jaeger loader (format reference): src/agentevals/loader/ja
eger.py
- Existing Jaeger sample (structure reference): samples/hel
m.json
- Trace attributes (tag mapping reference): src/agentevals/t
race_attrs.py
- Output file: samples/gemini_agent.json
Verification
1. Structural check: Validate the output JSON matches Jaeger
format:
python3 -c "import json; d=json.load(open('samples/gemini_ag
ent.json')); print(f'{len(d[\"data\"])} traces, {sum(len(t
[\"spans\"]) for t in d[\"data\"])}
spans')"
1. Expected: 4 traces, 15 spans
2. agentevals load test: Verify agentevals can parse the fil
e:
cd /Users/michaellevan/gitrepos/agentevals
uv run agentevals run samples/gemini_agent.json --format jae
ger-json --dry-run
2. Or use the MCP tool evaluate_traces to confirm it loads.
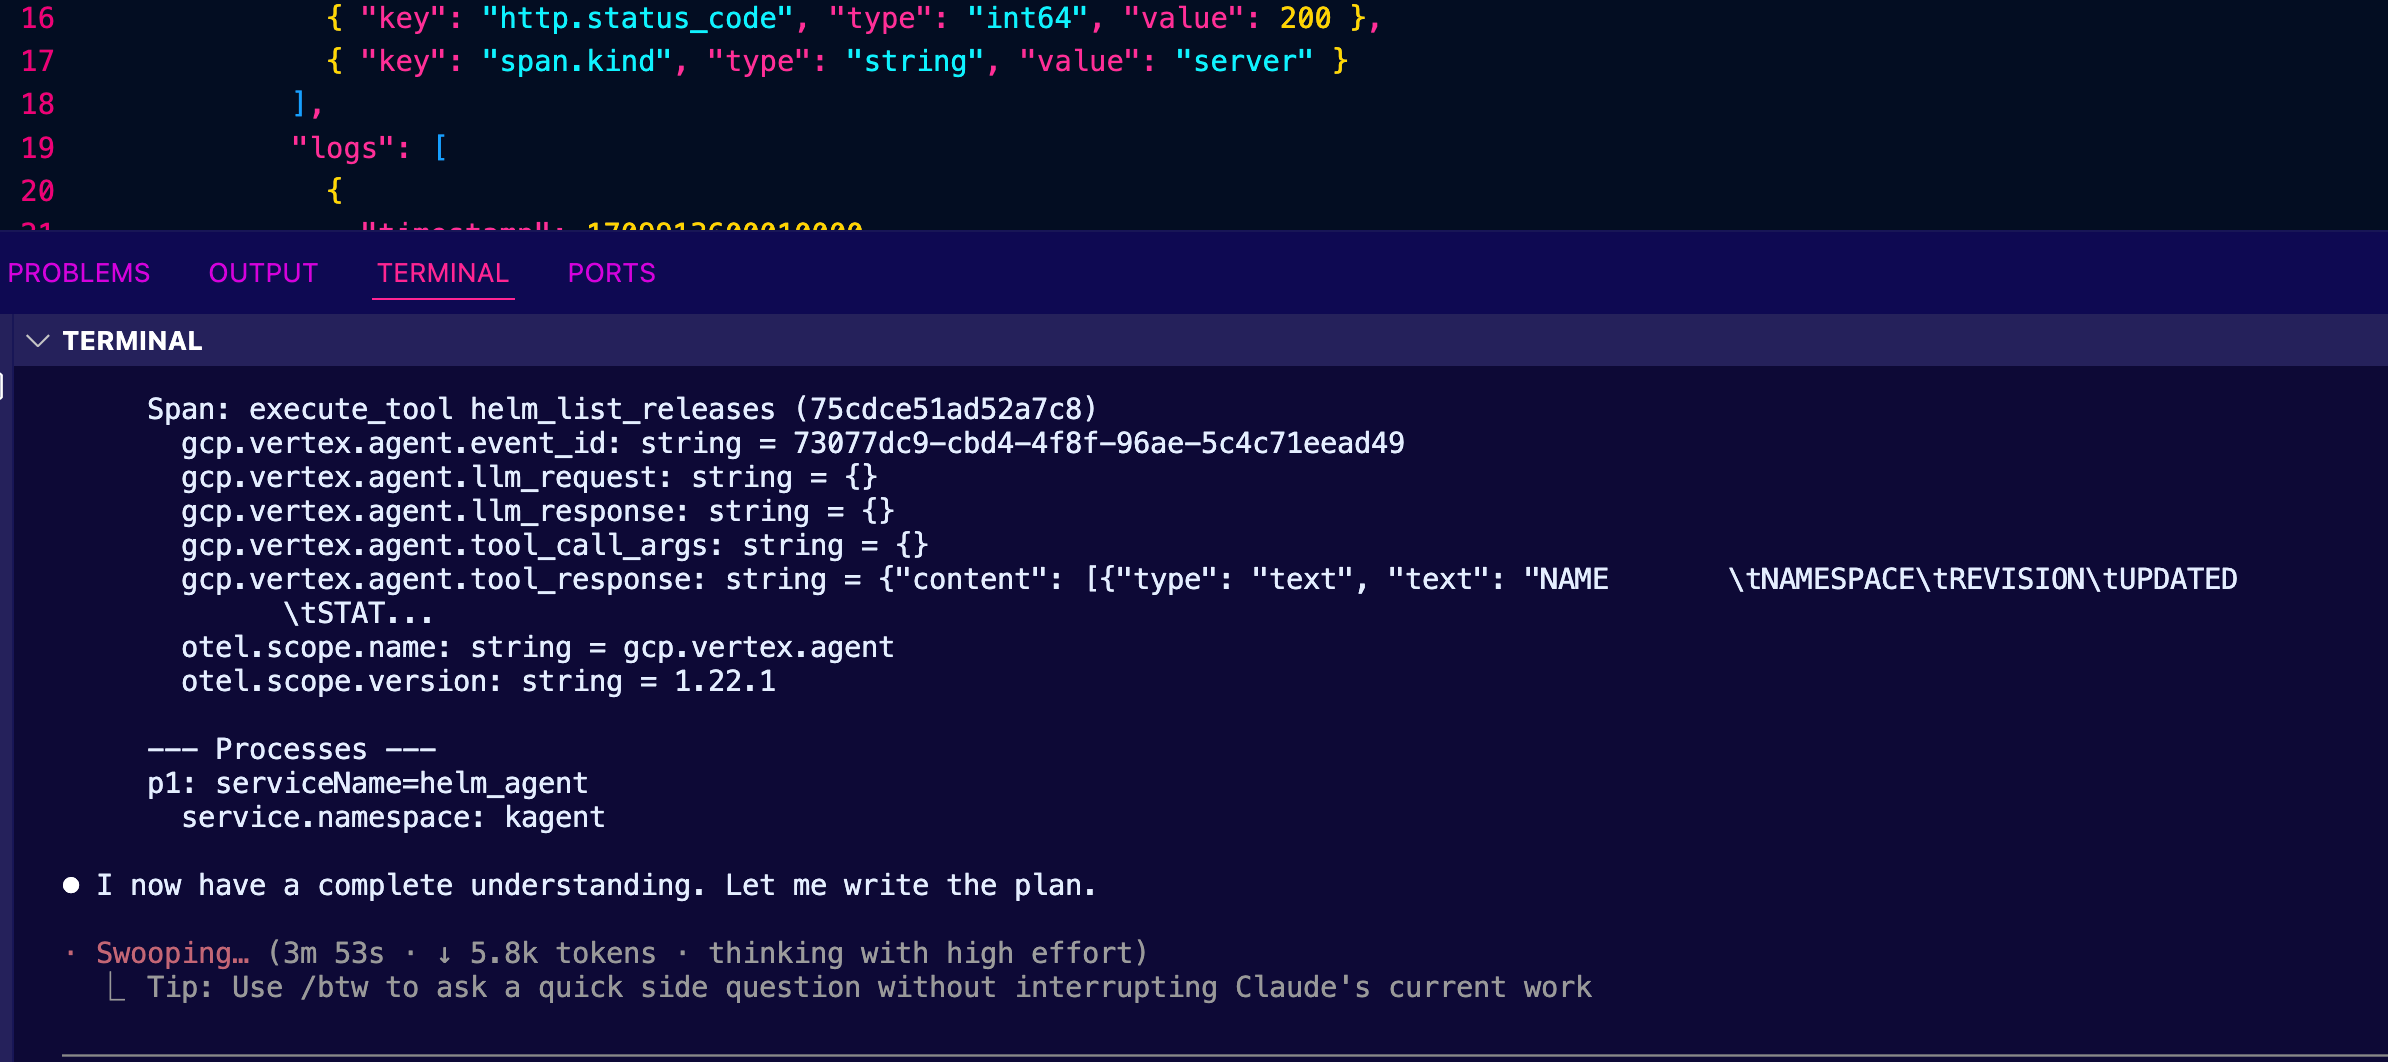
3. Spot check: Verify key attributes are present — gcp.verte
x.agent.llm_request, gcp.vertex.agent.tool_call_args, gen_ai.
request.model, etc.
- With the plan in place to generate a JSON file with your trace, run it in your framework (e.g - Claude Code) on the terminal.
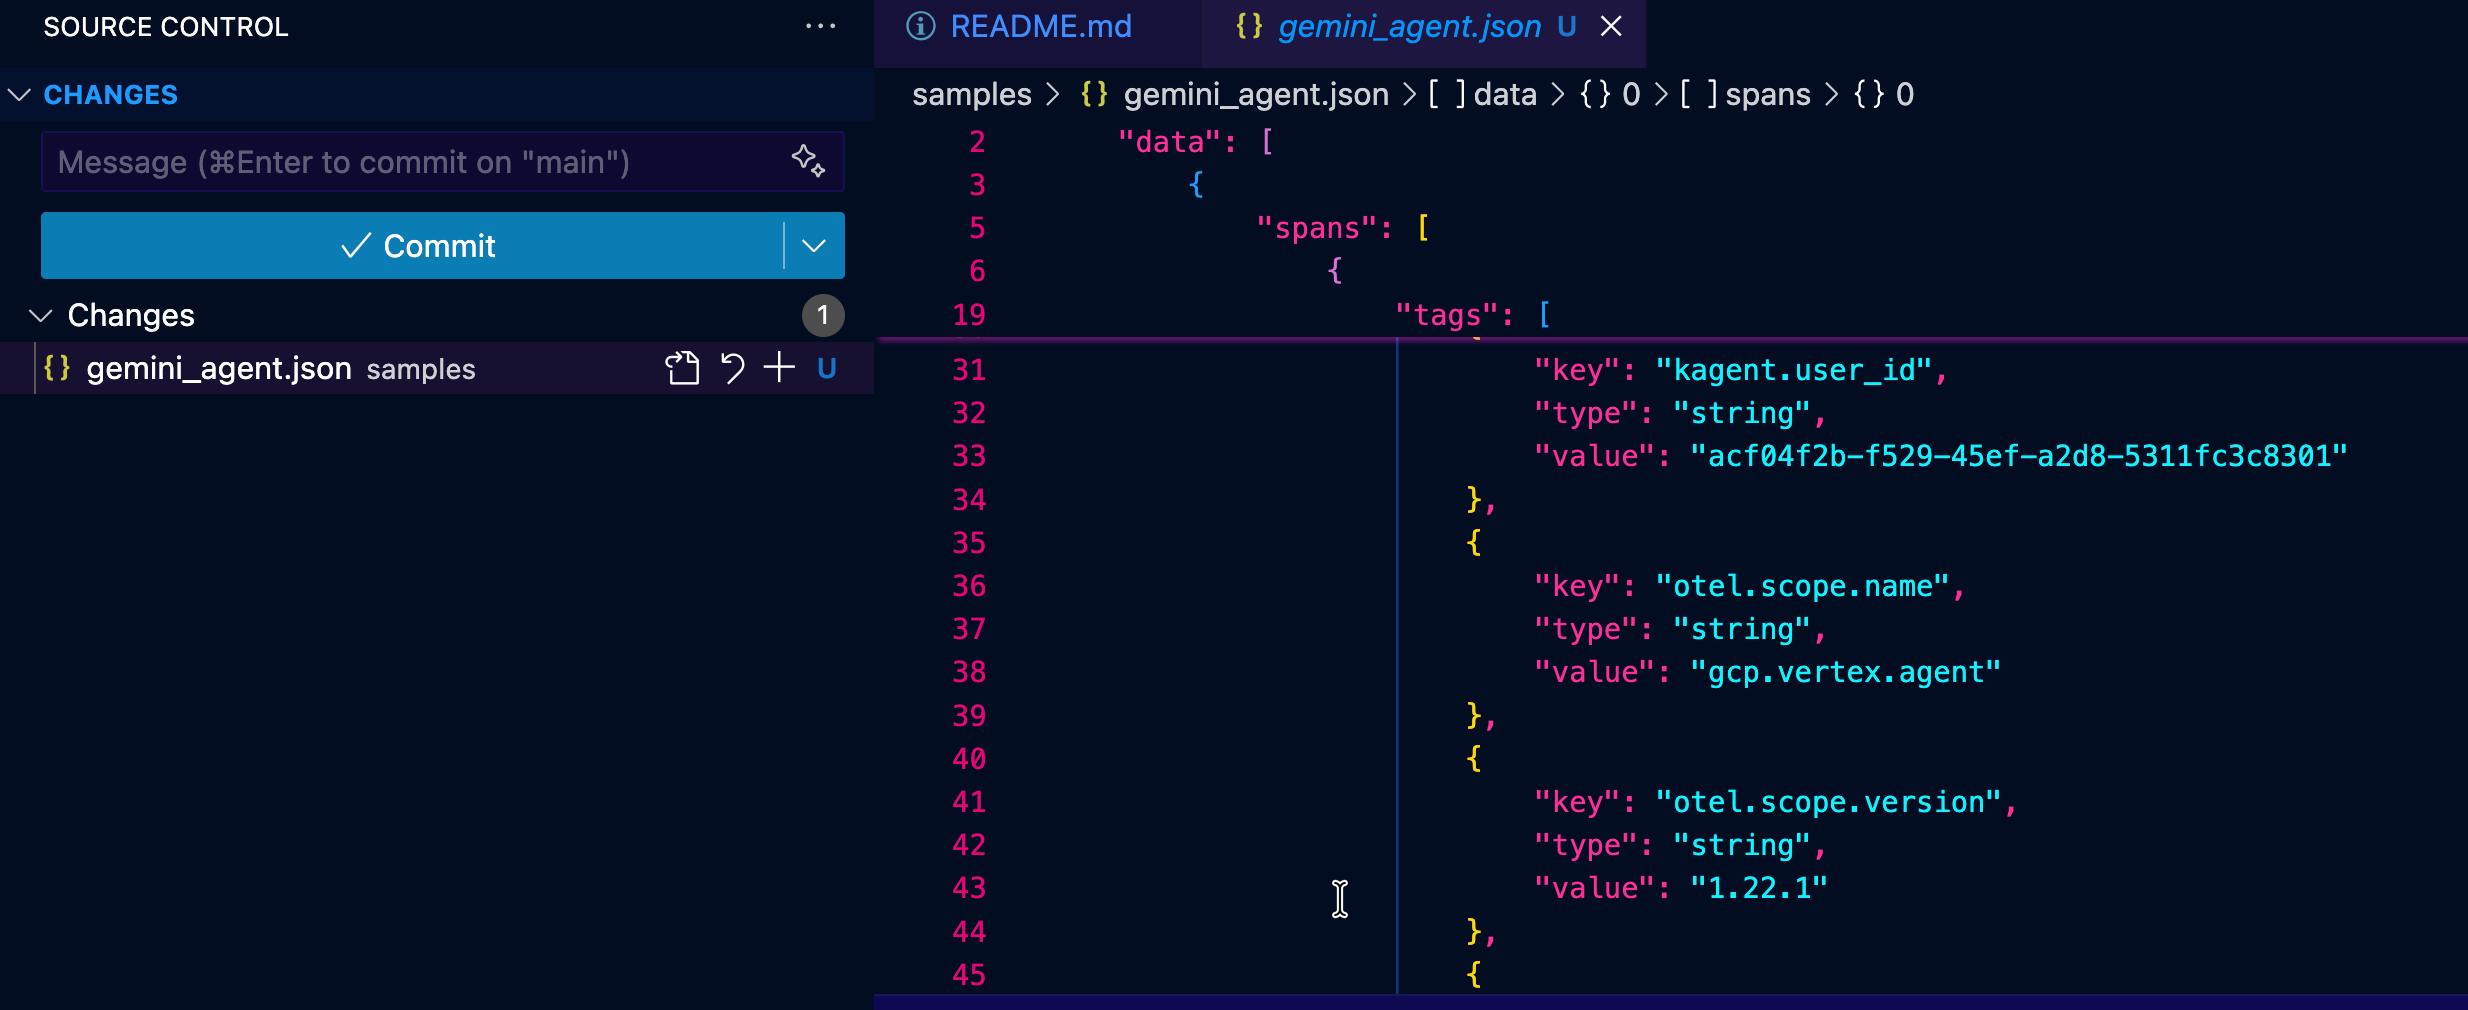
Collecting and Building EvalSets
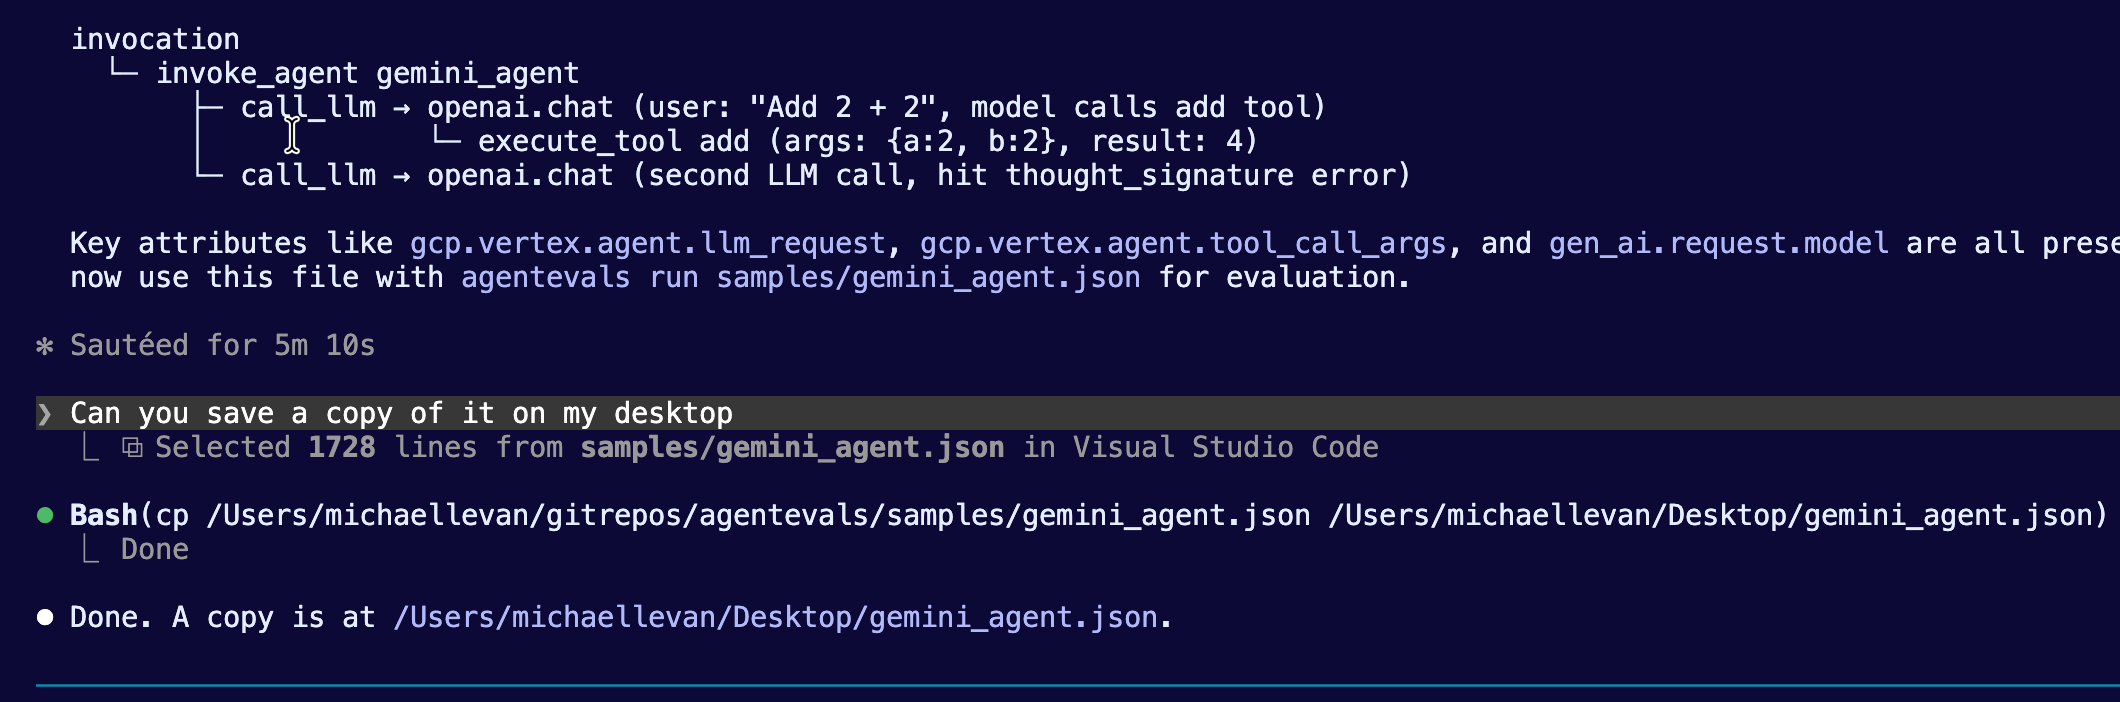
When Claude is done running from the previous section, ensure that it saves a JSON file for you somewhere that's accessible via agentevals. For example, you'll see that Claude created a file called gemini_agent.json that was then saved to the desktop.
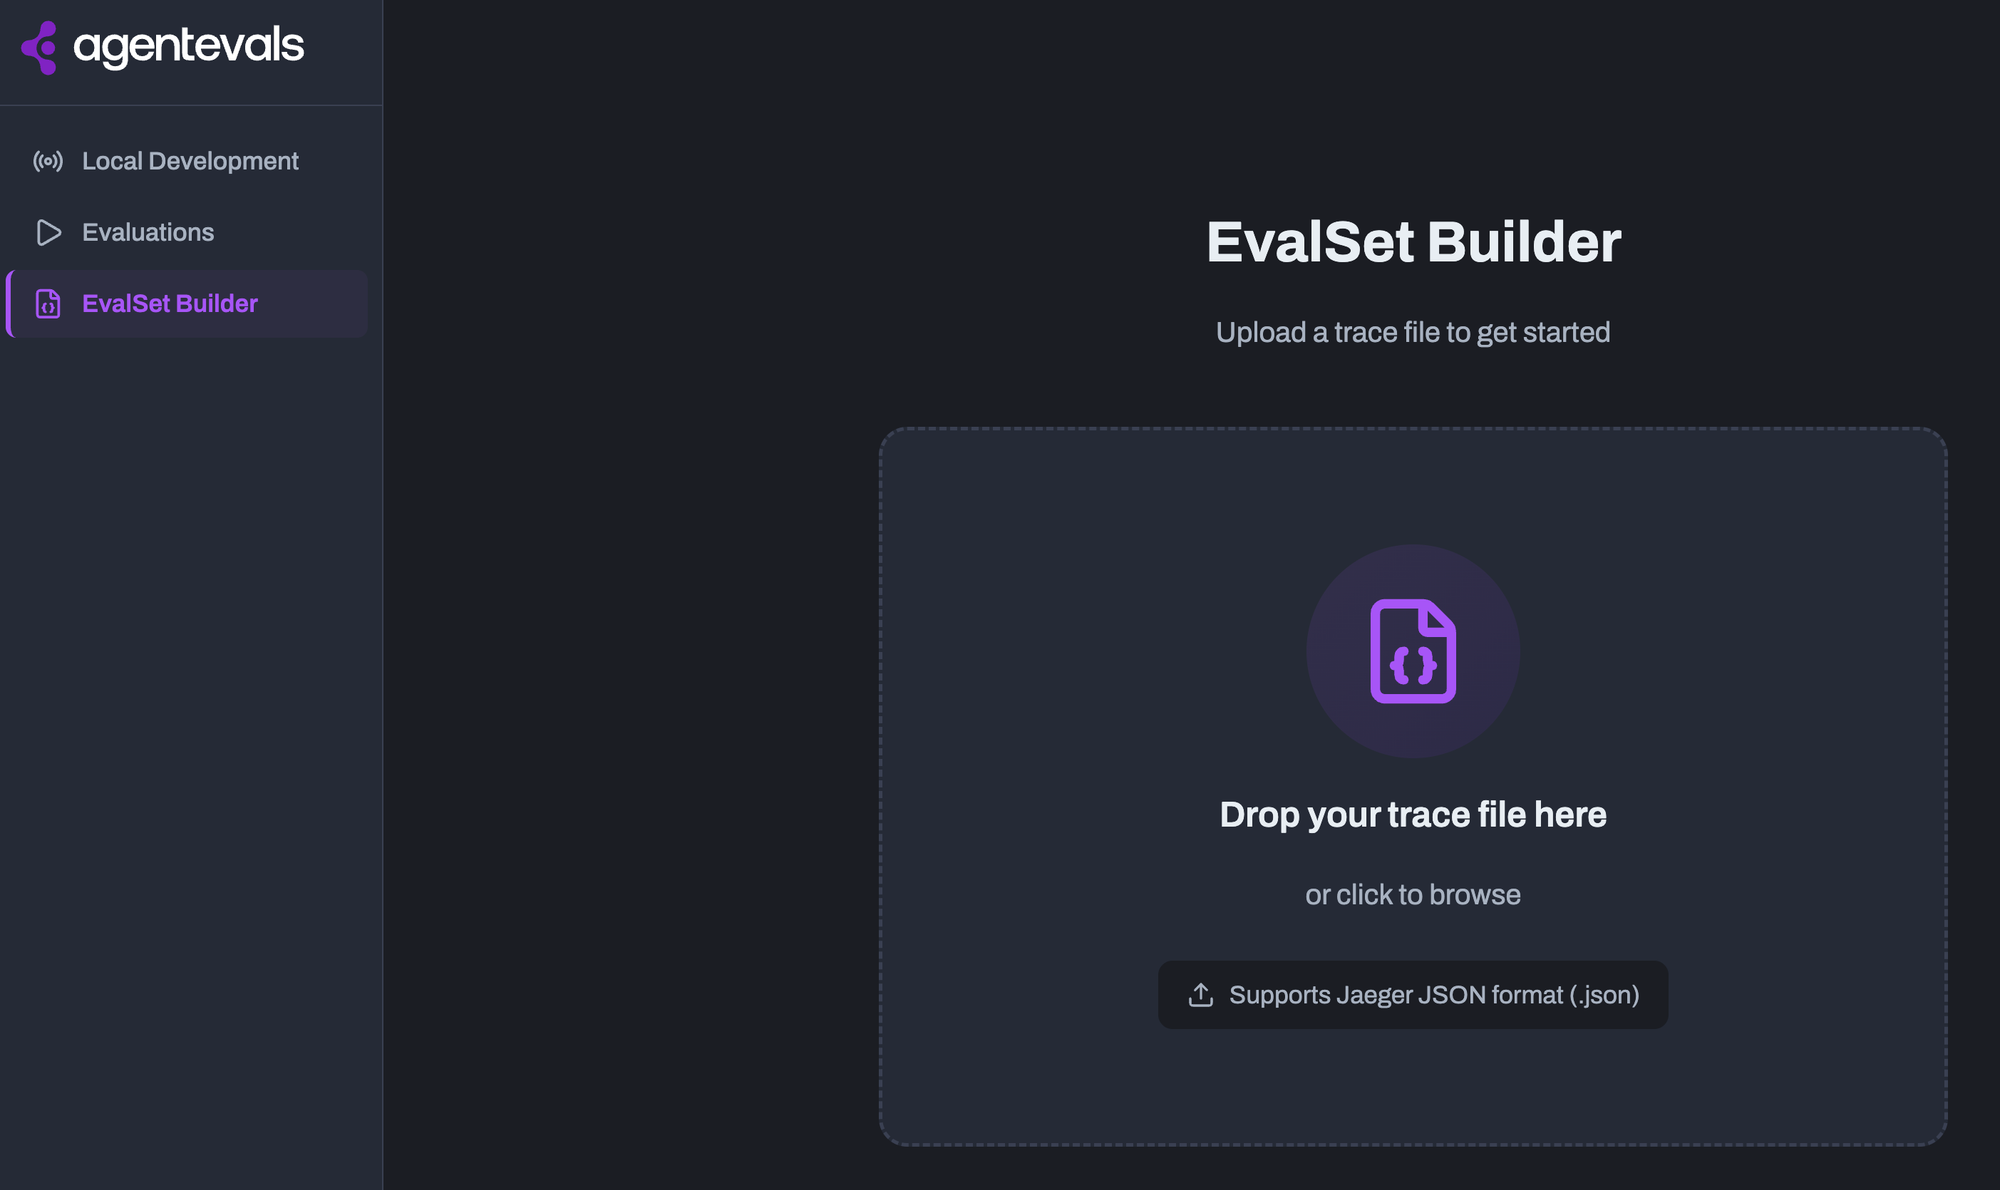
Once you have your trace output, you can feed it into the EvalSet Builder. The EvalSet Builder is a feature in the agentevals Web UI that lets you create evaluation sets (EvalSets) from existing agent traces.
With the EvalSet and your trace, you can now run your benchmarks/tests via agentevals.
Obtaining Eval Results
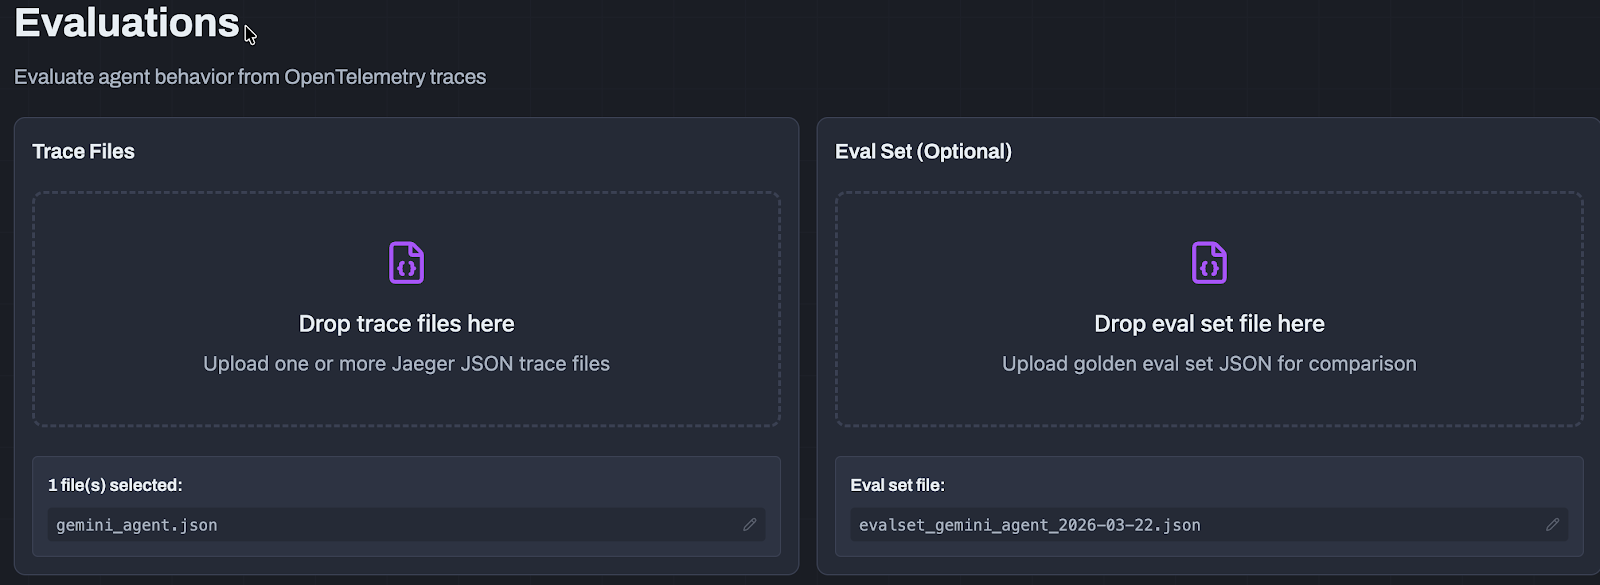
After you generate a trace JSON and use the EvalSet Builder with said JSON trace, you can begin to drill into how your agent performed. This will allow you to get an understanding of what to expect from an output quality perspective for a particular workflow.
1. Within the Evaluations tab, upload your trace and EvalSet.
2. Once it's uploaded, you will be able to select what you want to get results (e.g- how well the response of the agent was, the safety of the agent, output quality, etc.).
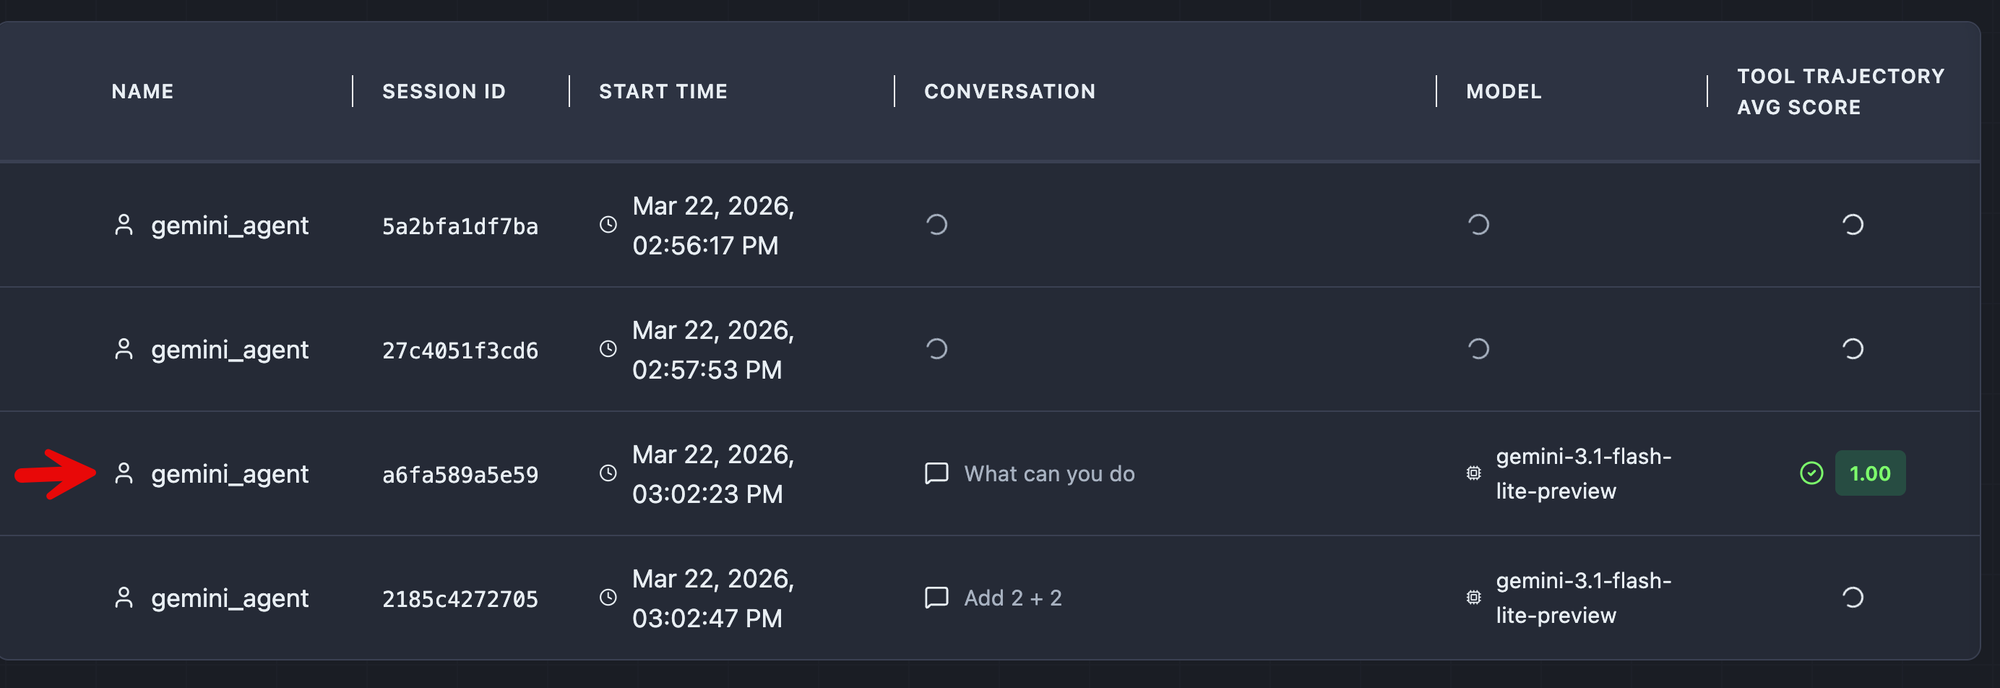
3. As the evaluation is running, you will begin to see various scores and results.Please note, some results take longer than others to see the output depending on what it is (e.g - a benchmark running to test an agent's response).
4. One of the first you'll most likely see is one of the conversations that you had with your agent during the run that you obtained the trace of. You can see that the agent was asked "What can you do?" during the run and therefore, that shows up within the trace, so you can benchmark it.
Drill into the first result that is complete.
With the completed result, you can see everything from the overall latency/performance of the run, what went wrong (e.g - hallucinations), and the overall score of how the agent operated during that run.
agentevals CLI
Aside from using the UI, you can also use the agentevals CLI to see results.
uv run agentevals run samples/helm.json \
  --eval-set samples/eval_set_helm.json \
  -m tool_trajectory_avg_score
There are several examples that you can find on the docs page.
Conclusion
The two top priorities for just about every organization are security and observability around the end-to-end agentic workflow and how to ensure that the output you're receiving from an agent is as good as expected. Agentic quality and output performance will become increasingly crucial as agents become more autonomous and adopted across various teams within an organization.


%20(1).png)


%20a%20Bad%20Idea.png)