I’ve gotten a lot of great feedback on my previous article, in which I covered how to use istioctl to quickly debug the Envoy configuration that Istio is distributing to the sidecars. In this follow-up article, I’m covering how to debug multi-cluster routing. I also cover how Istio joins workloads together across two independent clusters to enable higher values use cases like failover.
As an example, we will deploy a frontend Deployment and Service on both cluster1 and cluster2. Then, we will use the Istio Ingress gateway on cluster1 to route traffic to the frontend application on both clusters. We want traffic to stay on cluster1 but failover to cluster2 if the local frontend fails:
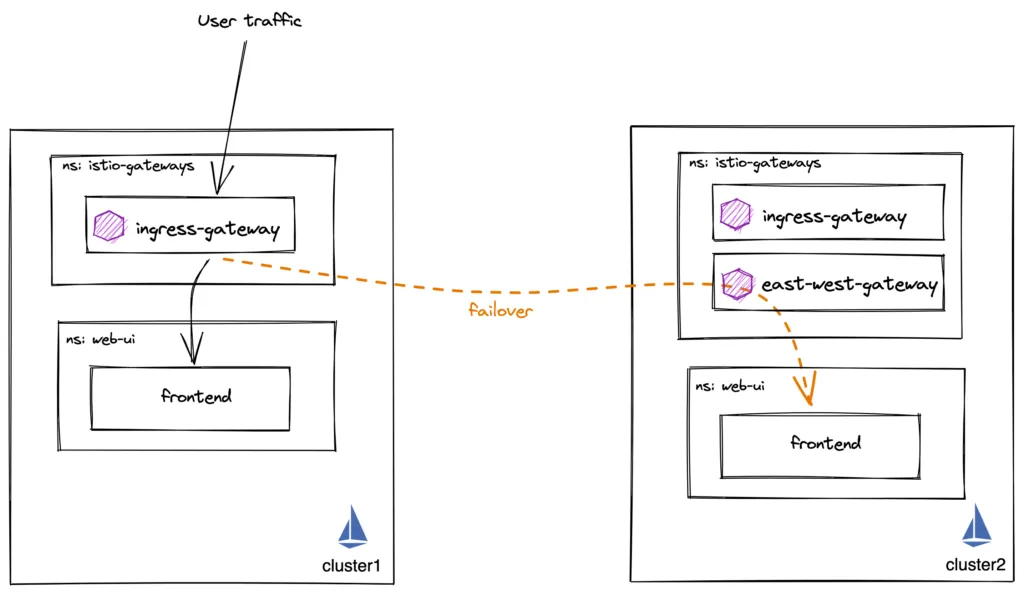
Let’s see the frontend pod running in both clusters. Note their Pod IP address:
cluster1:

cluster2:

There are few different patterns for deploying Istio Multi-Cluster. For security and scale reasons that I won’t cover in this blog, I recommend the multi-primary, multi-network deployment model and using east-west gateways for inter-cluster traffic. This gateway is just another Istio ingress gateway dedicated to east-west traffic.

Required Istio Resources for routing and failover
Next, let’s cover the Istio configuration we need to achieve our desired use case.
- ServiceEntry – Let’s us define a globally addressable host name, such as”frontend.mycompany.mesh”. My mesh applications can use this hostname to get global service routing.
- VirtualService – Route traffic from Ingress Gateway to the “frontend.mycompany.mesh” destination defined in the ServiceEntry
- DestinationRule – Used to define failover and outlier detection conditions
- Unified trust – Both clusters have intermediate certificates for Istio generated from a common root.
If you’re using Gloo Mesh, all of the above resources are created for you automatically if you create a VirtualDestination.What does Istio do with these resources?As I covered in my previous blog, Istio reads these resources, converts them to Envoy configuration and sends it to the sidecars and gateways. At a basic high level, this Envoy configuration can be broken down into listeners, routes, clusters and endpoint. A listener tells Envoy to bind to a specific port and uses filters telling it what to do, such as connect to a route configuration. A route has a list of domains that if matched, maps the request to an Envoy cluster. An Envoy cluster is then made up on a set of IP addresses which are the endpoints that back that Envoy cluster.Let’s take a look at the Envoy cluster configuration of the Ingress gateway on cluster1.istioctl pc endpoints istio-ingressgateway-54fdcf555d-v62p8.istio-gateways | grep frontend.mycompany.mesh

From this output, you can see that the ingress gateway knows about “frontend.mycompany.mesh” hostname and also the endpoint IP addresses that back that hostname.
There are 2 endpoints for frontend.mycompany.mesh.
1. 10.112.0.68:8080 – The local Pod IP’s of frontend pod. This is standard Istio discovering the pod on the local cluster.
2. 34.168.157.2:15443 – This IP and port points to the east west gateway IP of cluster2. This IP address was either defined in the frontend.mycompany.mesh ServiceEntry, or a WorkloadEntry which was selected by the ServiceEntry:
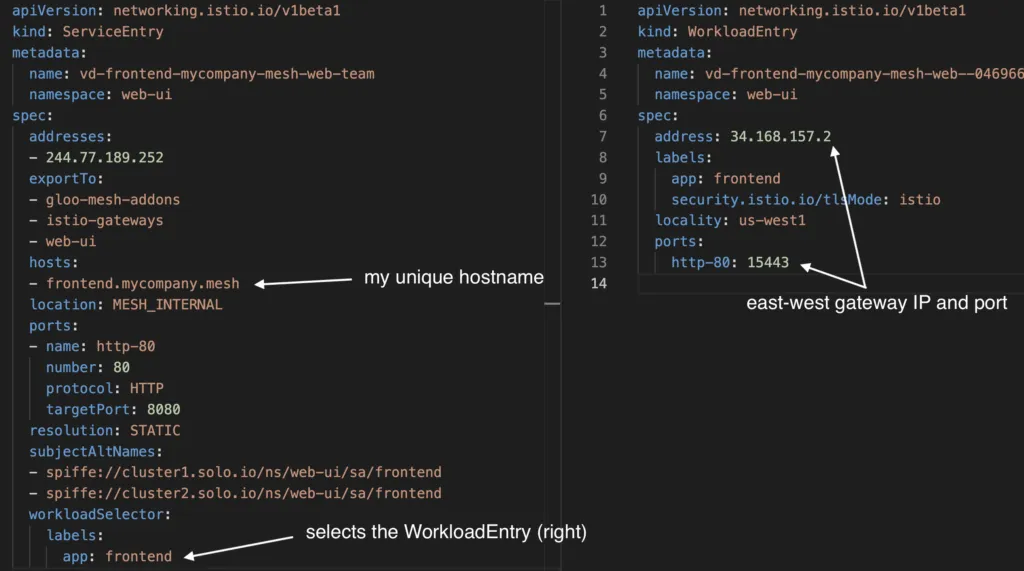
Again, if you’re using Gloo Mesh, these ServiceEntry and WorkloadEntry objects are automatically generated and kept up to date.
Locality Load Balancing
How does Envoy know to prioritize sending traffic to the local endpoint, and not the remote? Let’s look at the same output in more detail:
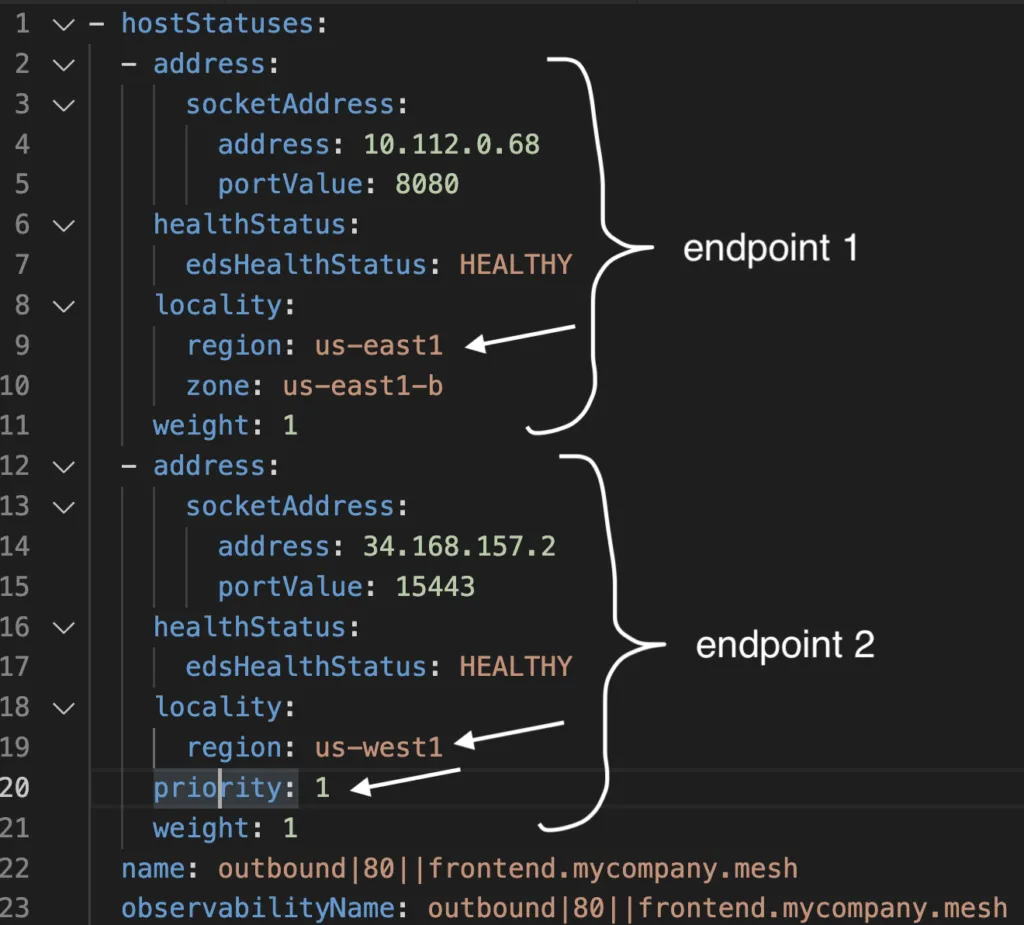
Notice the priority field. The first endpoint does not have priority defined, which means it’s priority is 0. The second endpoint’s priority is 1. Envoy will load balance all traffic to the highest priority (lowest number). If those are unhealthy, it will then jump to priority 1.
Next, note the locality field. For local endpoints, the locality is picked up from topology labels on the Kubernetes nodes. For remote endpoints, this information should be provided in the ServiceEntry or WorkloadEntry.
Access Logging and Stats
When a request is not being routed correctly, or you’re seeing an error response code, you should immediately enable access logging on the gateway or sidecar. Lets look at a sample access log at the ingress gateway:
The matched Envoy cluster, endpoint IP, port, response code, time, protocol are all listed! As you can see, traffic went to my local 10.112.0.68:8080 frontend endpoint.
If we scale frontend on cluster1 down to 0, we expect traffic to now go to frontend on cluster2:
Notice that we’re now going to the 34.168.157.2:15443 endpoint, which is the east-west gateway IP address in cluster2!
Last but not least, let’s look at some stats!
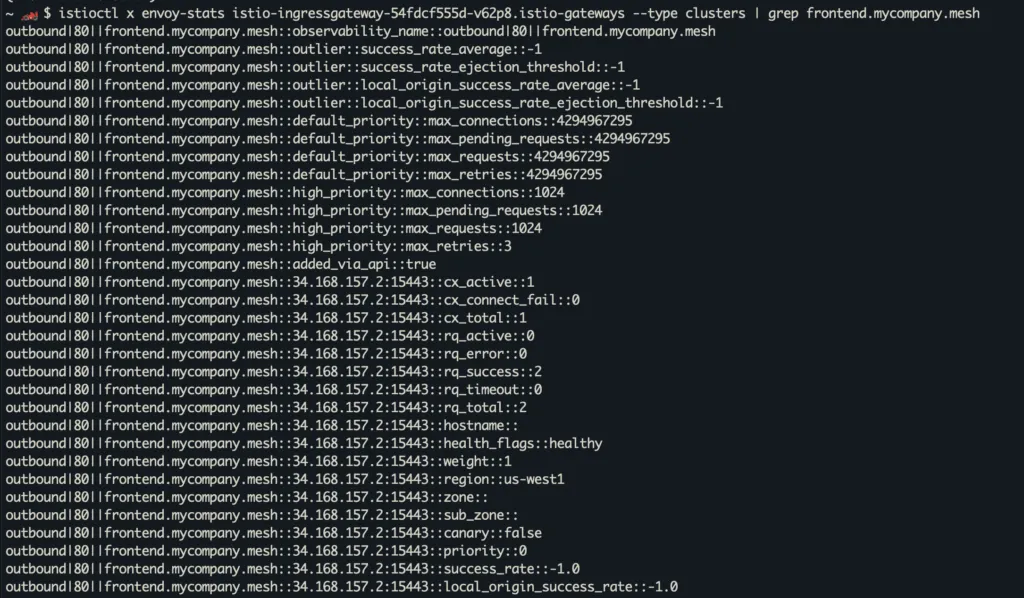
This gives you a detailed breakdown of all the endpoints, their metadata, as well as stats on how many requests they are getting, their error and success rates, etc. This is extremely useful when you’re seeing intermittent errors where one of your endpoints is not functioning well.
I hope you found this helpful. At Solo, we have customers who are deploying some of the largest deployments of service mesh and Istio in the world. We have an amazing team of field engineers who are experts in Envoy and Istio, and work closely with our customers every day.
If you have any questions, reach out to our experts!












%20a%20Bad%20Idea.png)


%20For%20More%20Dependable%20Humans.png)
