One of the most common questions we get from Solo.io customers is about the number of replicas and architecture needed to use the Istio Ingress Gateway at scale.
We’ve seen many use cases where the Istio Ingress Gateway is one of the most important components in Istio. This is because it’s what handles the ingestion of traffic coming from outside. Due to the importance of its mission, the Istio Ingress Gateway designed to be solid and able to sustain high amounts of traffic out of the box.
In this post, we’ll work to find the limits of this component, stressing a single instance, so you can use the information to properly size your system and avoid unnecessary overallocation of costly resources.
The relevant parameters we are going to consider are CPU and memory consumption, response times, and response codes. We will also observe the receive/transmit bandwidth, and deduce the key resources when we put Envoy to the test.
ℹ️ NOTE: The complete set of scripts and code used to write this blogpost can be found in this repo.
Table of Contents
- Setting Up the Istio Ingress Gateway and Grafana
- Load Testing the Istio Ingress Gateway With K6
- Visualizing the Istio Ingress Gateway Metrics in Grafana dashboards
- Analyzing the Istio Ingress Gateway Performance Under Load
- Conclusion
To properly test the Istio Ingress Gateway under load and gain observability into its performance, Grafana tools can be used. Specifically, the open-source K6 load testing tool from Grafana Labs and pre-built Istio dashboards in Grafana.
We are going to configure a non-trivial setup of 1,000 unique DNS domains, each of them exposed with TLS certificate, and serving 100 different paths. If you are familiar with Envoy, this is about 150MB of envoy configdump.
Setting Up the Environment
We will use a single EKS cluster, composed of different nodes:
- 6x t3.2xlarge (8cpu/32Gi) for general purpose (echoenv app, prometheus, grafana, gloo, K6 operator)
- 1x c5.4xlarge (16cpu/32Gi) for the Istio Ingress Gateway (only deployment in that node)
- 6x t3.medium (2cpu/4Gi) to execute the tests (K6 runners)
First, deploy an Istio Ingress Gateway in the Kubernetes cluster. To do this, we are going to use the Istio Lifecycle Manager, but any other supported method is also fine.
Then, install the K6 operator (version 0.0.9 was used to write this blogpost) and Grafana with the Istio dashboards.
Configuring the Ingress Gateway
The Istio Ingress Gateway acts as a reverse proxy to route external traffic to services in the cluster. It can actually route traffic to other external services, but let’s keep it simple.
For testing, configure the gateway to route traffic to a sample app, in this case the echoenv image as we did in other blogposts. This can be done by creating an Istio VirtualService (VS) that routes traffic from the ingress gateway to the app.
We will be using a Routetable to generate the necessary Istio resources, but you can create the VS directly as well:
The Istio Ingress Gateway is now ready to serve 1,000 different domains, each one of them with 100 unique paths configured, like https://workspace-10-domain-100.com/get/100.
Running the K6 Load Test
To be able to send a high amount of traffic to the Istio Ingress Gateway, we can’t rely on a single machine. Our test executor must be distributed.
Grafana K6 operator was designed to address this issue, and it is really simple to use. After the initial installation, we just create a K6 resource:
Let’s also have a look at the actual K6 test, located in a configmap:
You can see that the test is using one of the well-known K6 executors, so it is really just a few lines of code. In this case, we want to send all the traffic we can from 18 K6 distributed runners to a single pod of Istio Ingress Gateway:
Viewing Metrics in Grafana
While the load test is running, Grafana dashboards provide visibility into how the ingress gateway is performing under load. Dashboards show metrics like request rates, response times, error rates, and resource saturation. This data can be used to determine maximum load the gateway can handle as well as potential bottlenecks.
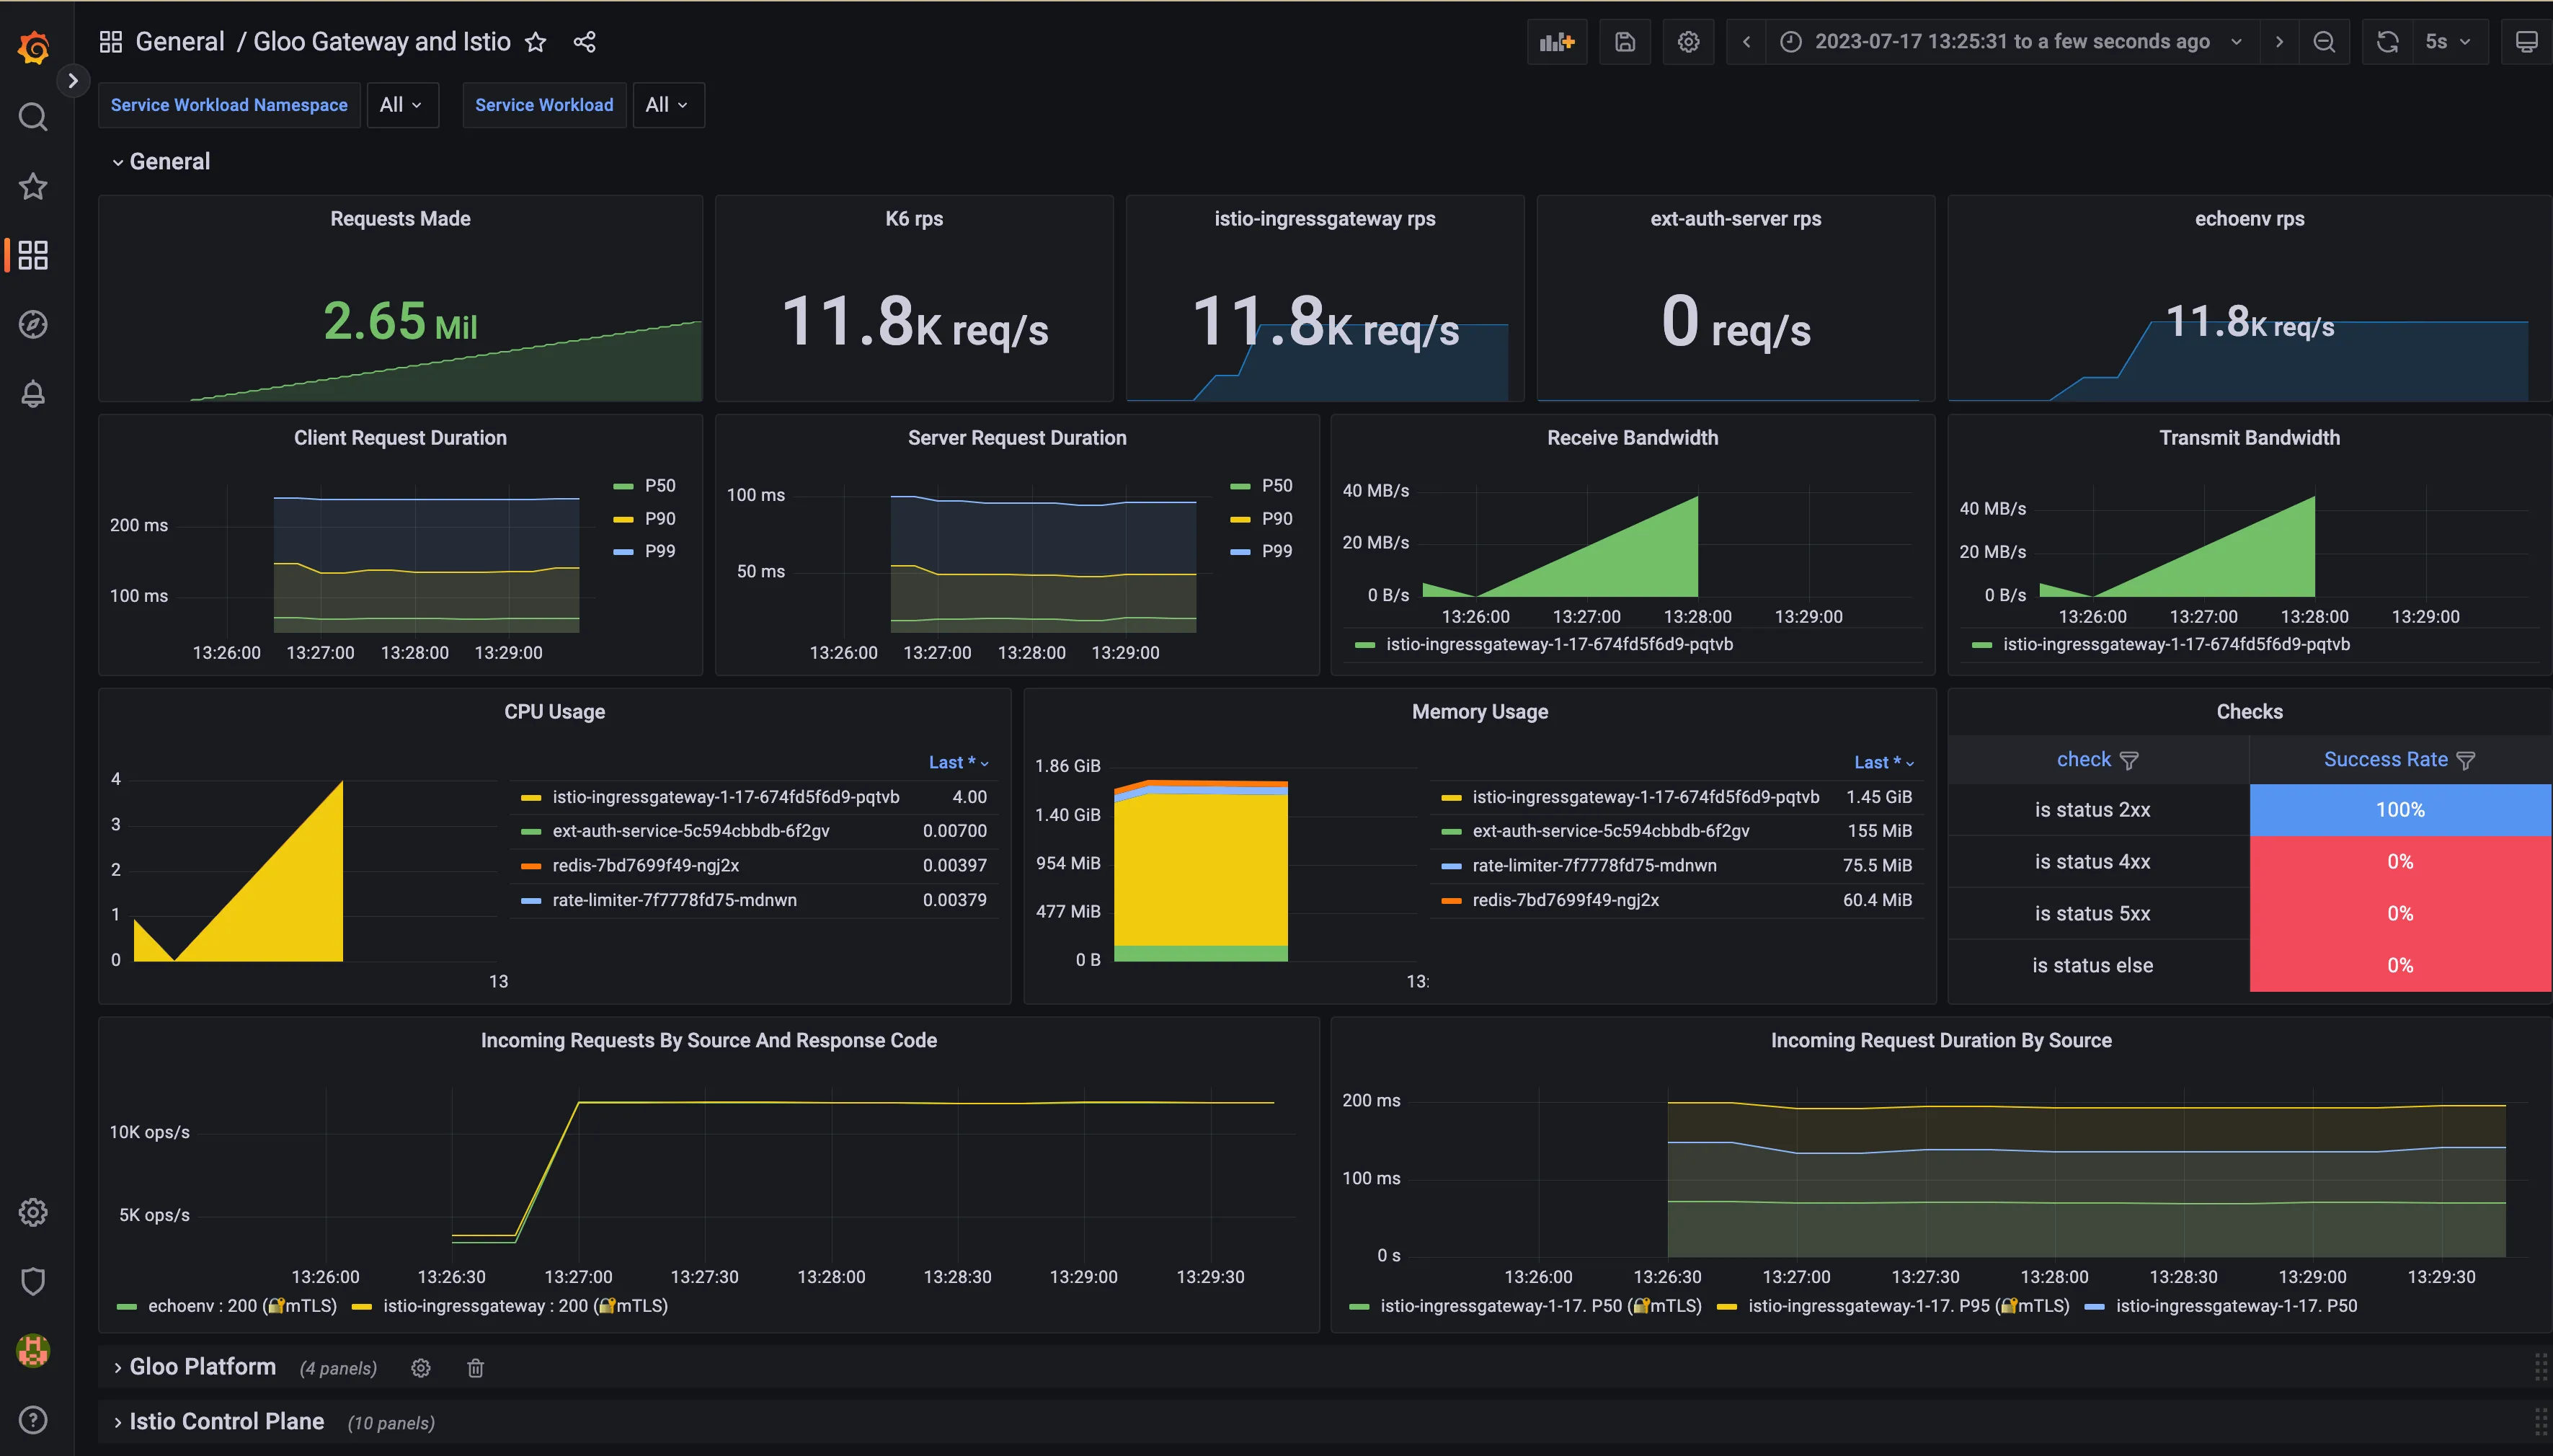
In the custom dashboard, we can see metrics coming from different sources:
- Istio Ingress Gateway
- Total of requests made during the test
- RPS from different perspectives (K6, Istio IG, Destination)
- CPU/memory usage
- Request duration and response codes
- Istio Control Plane dashboard: Not relevant for this blog post
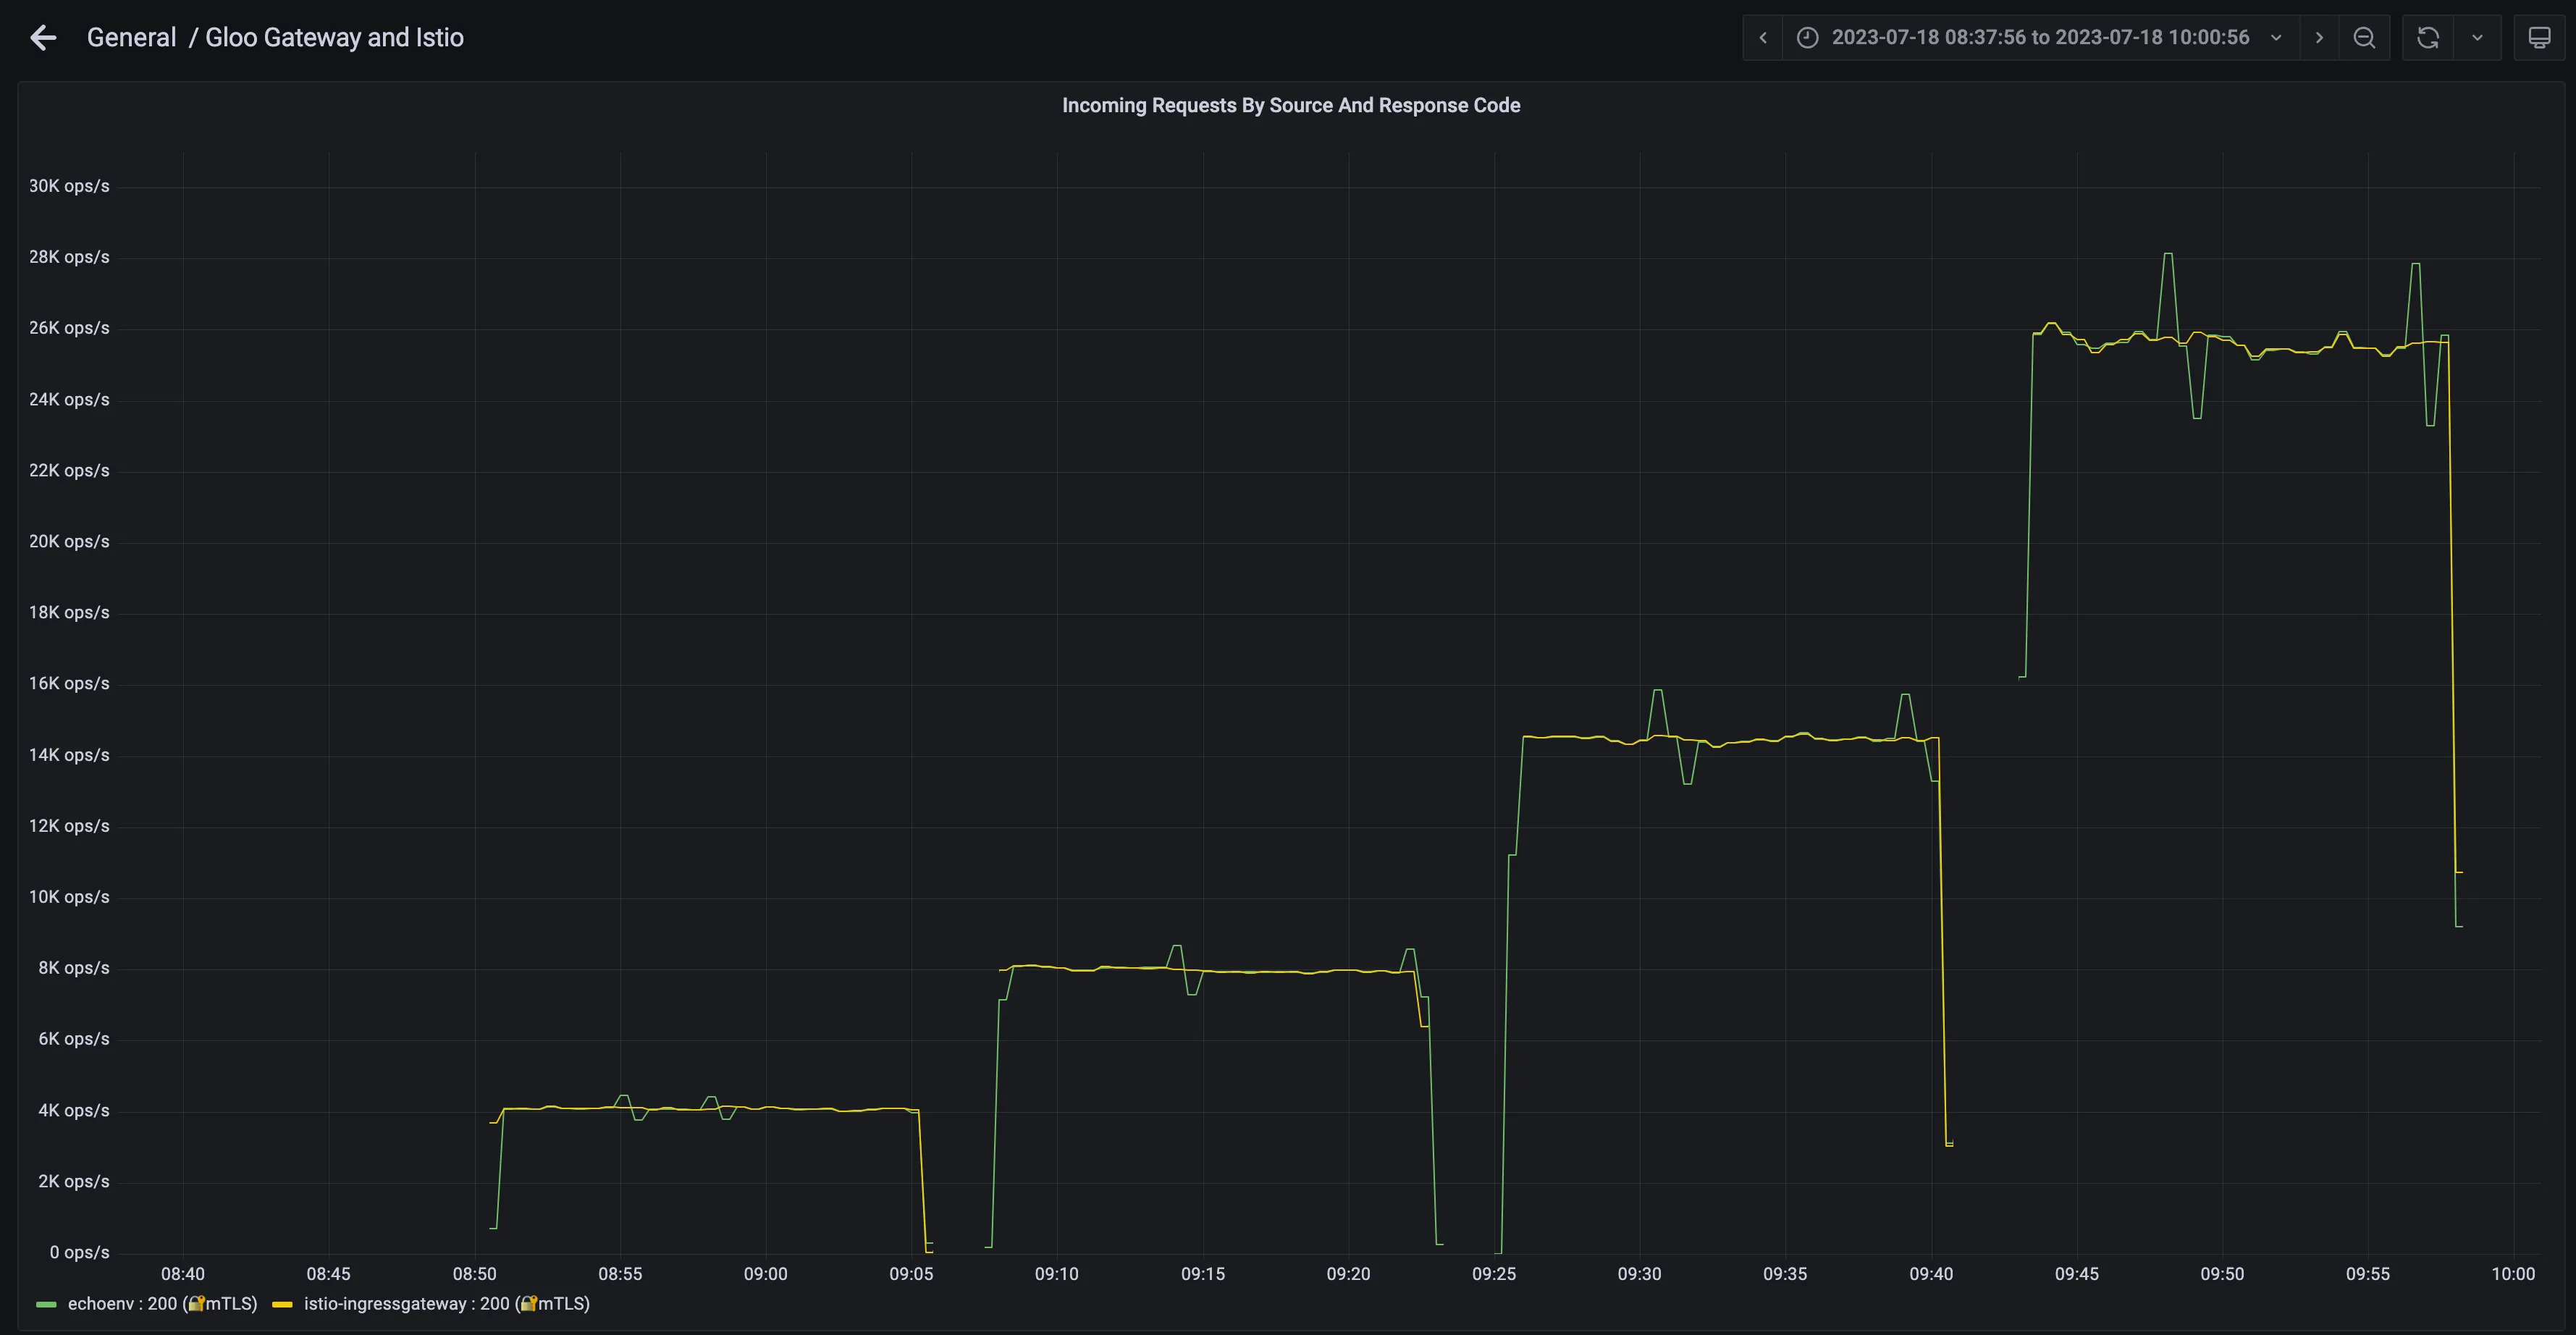
To properly test the performance and reliability of Istio’s Ingress Gateway, it’s important to simulate traffic at high volumes. We will run a script to limit the CPU that the Ingress Gateway can use, first using 1 CPU, then 2, 4, and finally 8. The memory will be a fixed value of 4Gi.
This simple scenario will send GET requests to the /get/n endpoint of the Ingress Gateway, that will rewrite the request to be sent to / in the upstream server. Once K6 operator is in action, you will see that it creates 18 pods, each one of them executing a portion of the total requests to be sent.
Using this approach, you can use many cheap spot machines for your tests, for a virtually unlimited throughput:
Another cool thing about this many tester pods is that they produce metrics, so you can ship them to an external Prometheus, like we are doing.
It is also possible to ship them to an OpenTelemetry collector, where we can manipulate them before sending them to the final destination, which is usually a prometheus instance.
After some time, you can have a very nice overview of what is happening in the system:
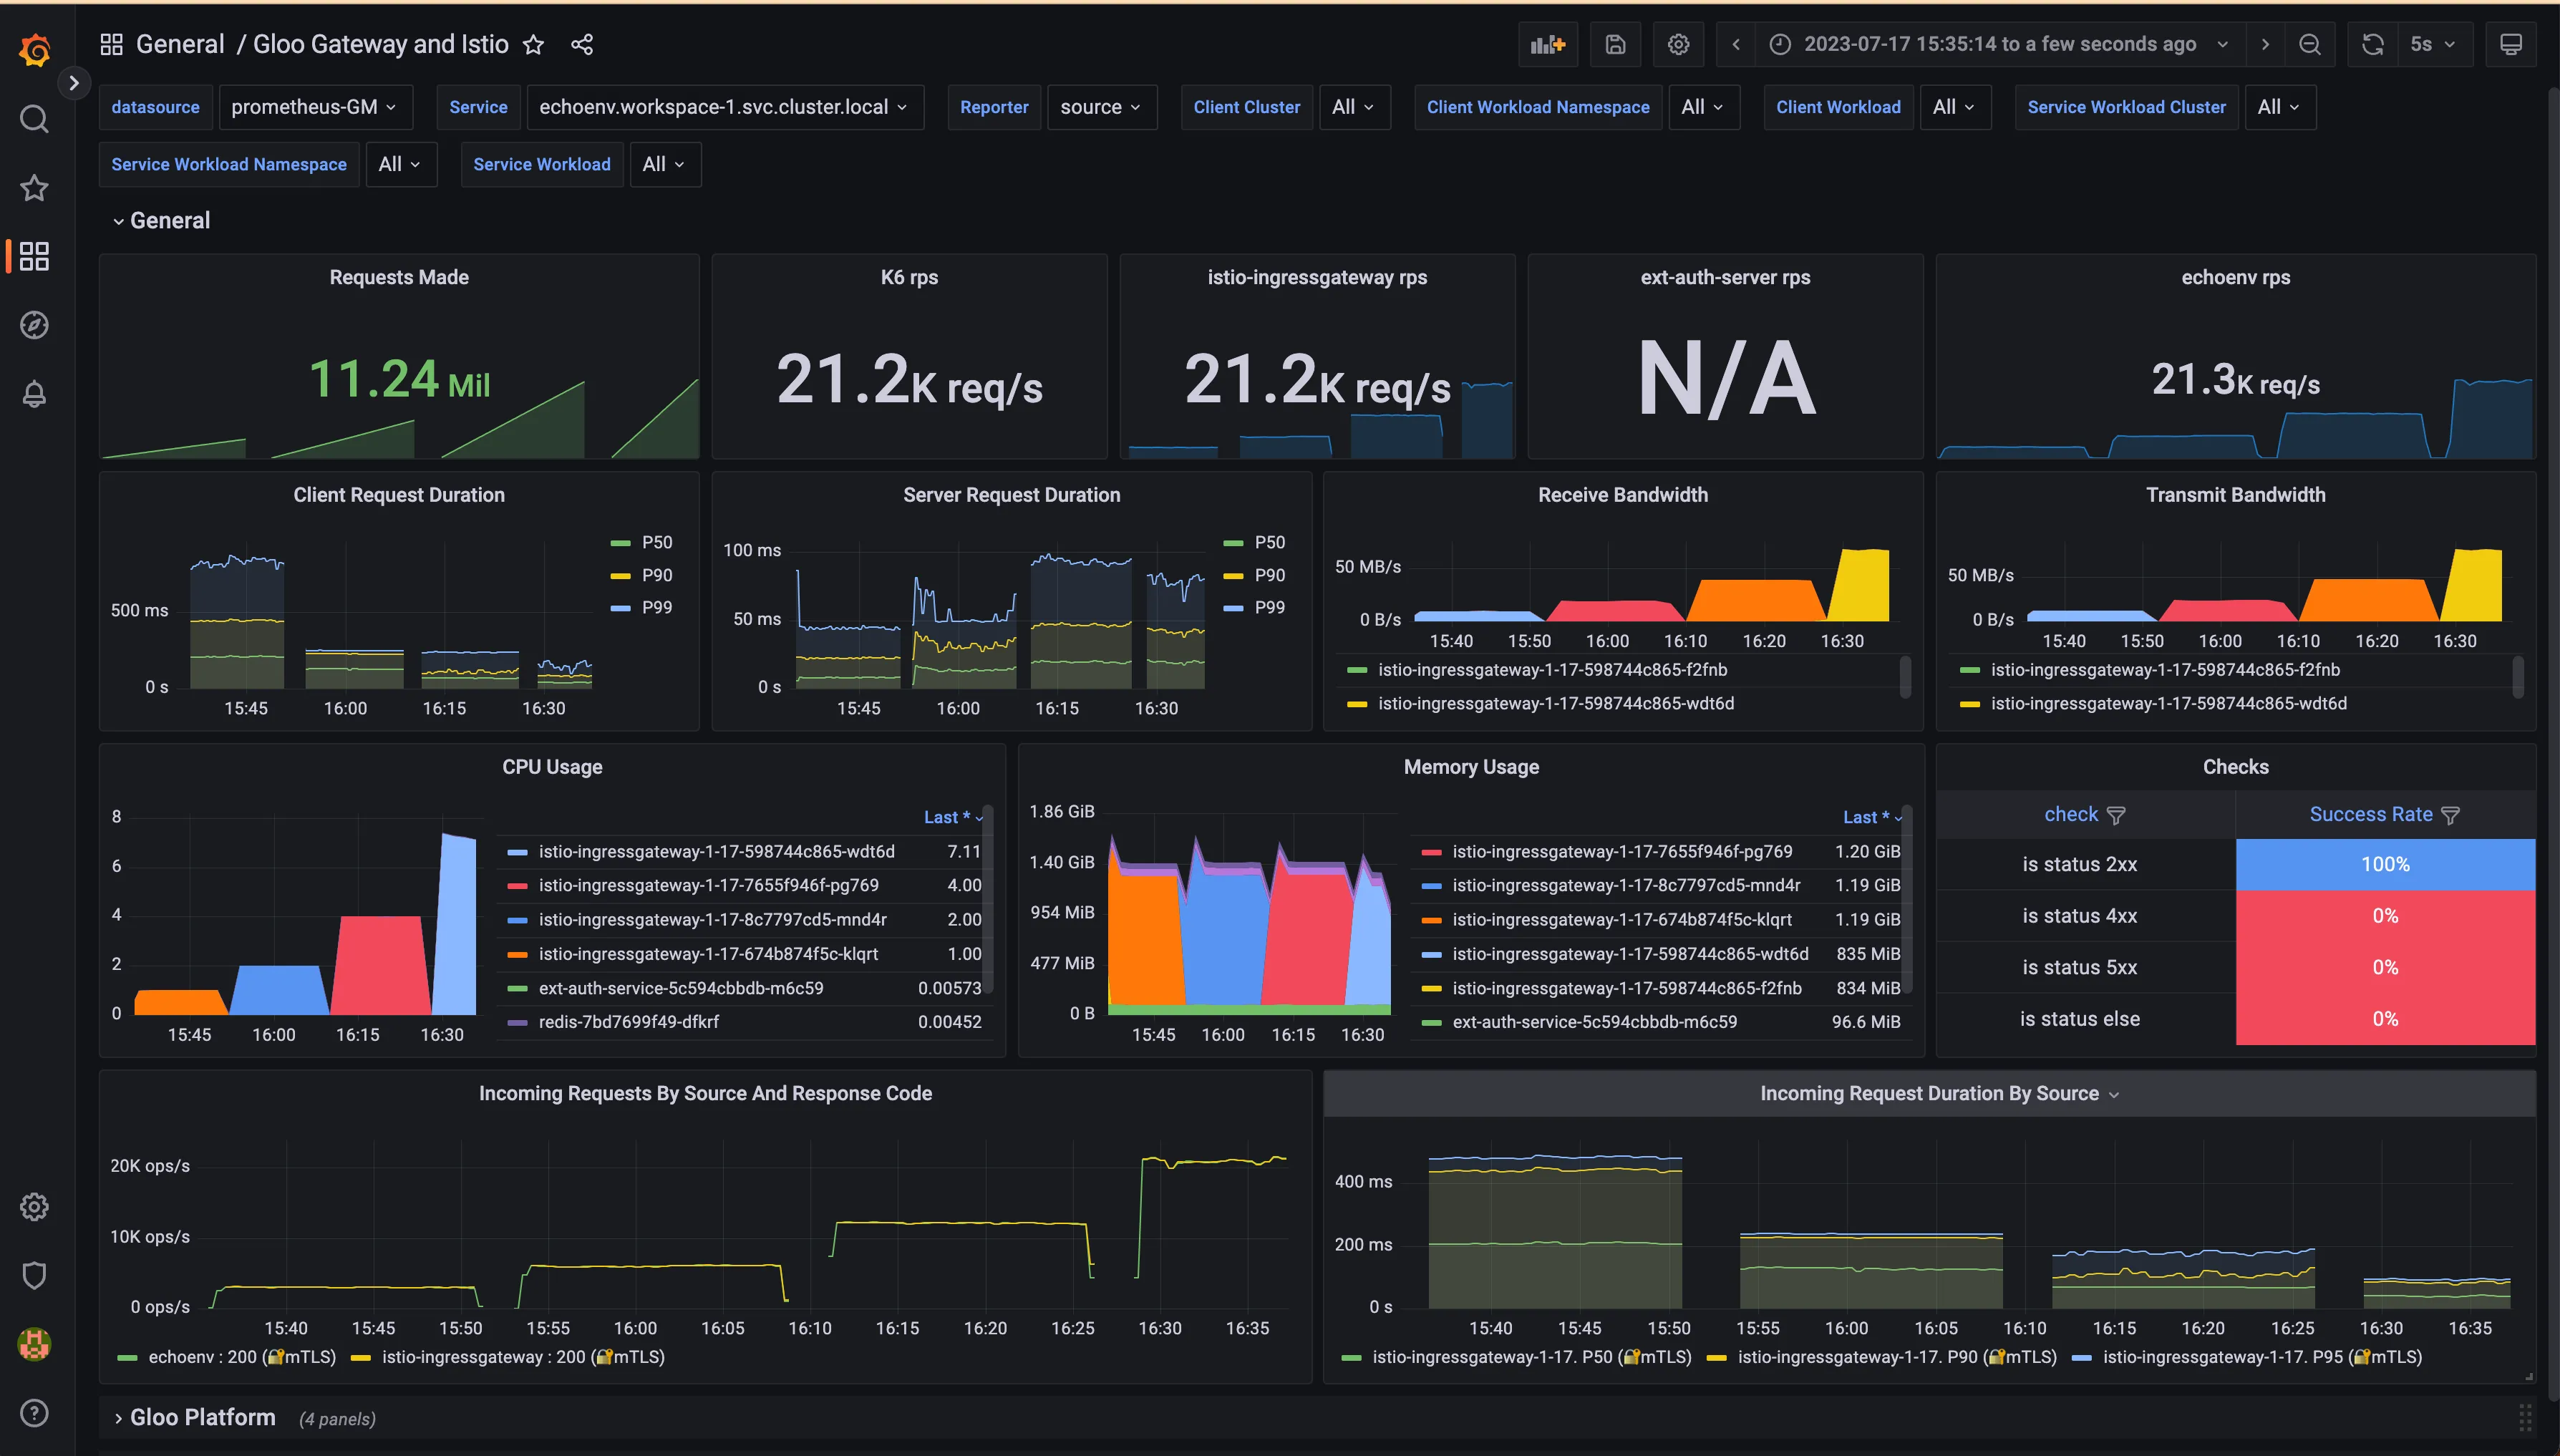
As we know from Envoy at scale data, Envoy can well sustain a little bit more than 2,000 RPS per CPU, so that was our expectation.
The version used for this test is 1.18.0, curated by Solo.io. It is essentially a hardened version of upstream Istio, with some enterprise filters that we won’t use for this test.
You can find the image in the workshops repository:
To analyze the performance of the Istio Ingress Gateway under load, let’s observe the final snapshot of our 4-phase test:
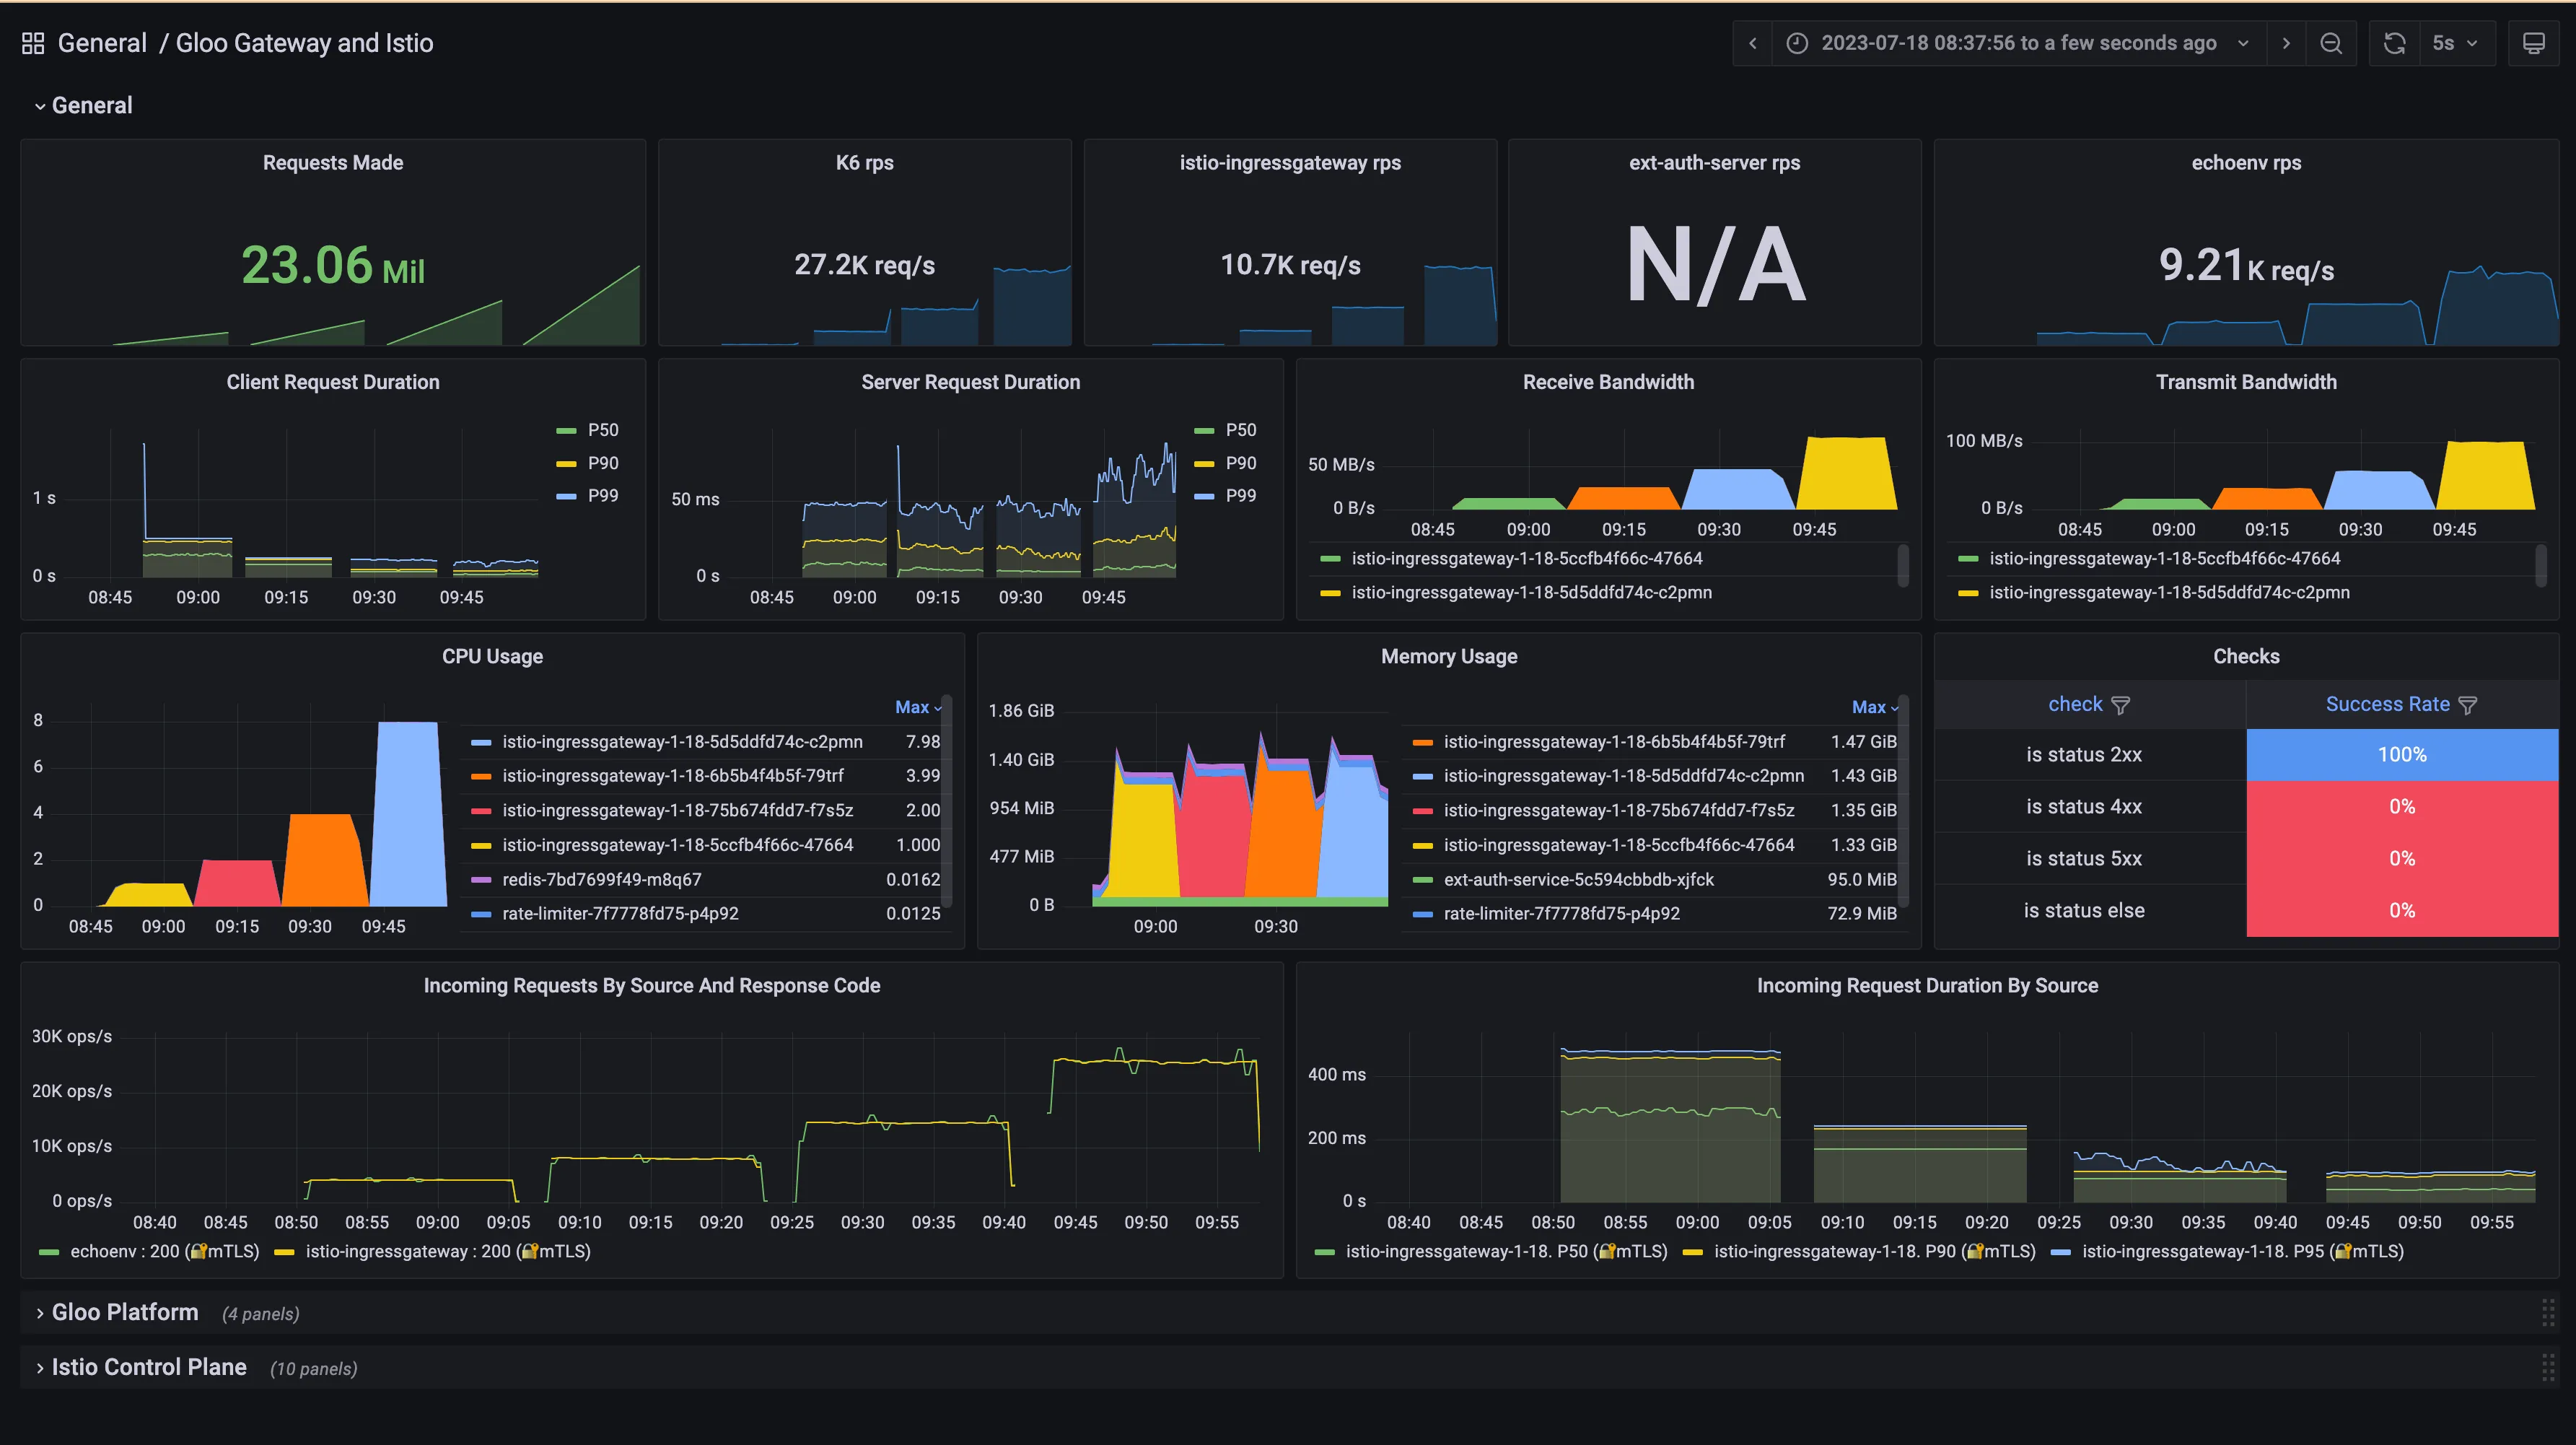
We were able to send a few million requests to the gateway in 4 intervals of 15 minutes. The number we see in the picture belongs to the last 15-minute phase.
Request Duration and Bandwidth
In the two left panels, we observe that the request duration at percentile 50, 90 and 99. In this context, the client is the Istio Ingress Gateway, and the server is the application.
In the two right panels, we can see the network traffic ingested/sent by the gateway, which is 83.1 MB/s receive and 101 MB/s in the yellow block.
This is really useful information, as you can imagine using the gateway at scale is only possible if we can provide the network capacity that is needed for all services exposed in the gateway, and also the traffic coming from the downstream.
ℹ️ NOTE: Remember that in production, you will want to use many replicas of the Istio Ingress Gateway, so the input/output network restrictions will be divided among them. The goal of this blog post is to see how well a single replica can perform.
Resource Usage
One of the well-known limiting factors of Envoy is CPU; the more CPU you give it, the more RPS you can get. This is why we can see that in each of the 15-minute phases, Envoy is using all CPU that it is available, so we can confirm that it is not wasting it.
We can also observe that the CPU utilization is very high, meaning that Istio Ingress Gateway will not waste the allocated CPU and will run close to 100% in all scenarios.
From a memory perspective, we can observe that it is fairly stable under 1.5Gi. The memory is used to store Envoy configuration (in our case 1,000 different domains), so once it is started you can expect it to be stable even under a heavy load.
During our load testing, not a single error was observed. This metric is coming from K6 executors, so the producers of the initial requests.
Requests Per Second and Response Codes
This information is the most interesting, as we mentioned we expected something around ~2k RPS per CPU, however the actual numbers were a bit better than that:
- ~4k RPS using 1 cpu = 353 million requests per day
- ~8k RPS using 2 cpu = 690 million requests per day
- ~14k RPS using 4 cpu = 1.25 billion requests per day
- ~26k RPS using 8 cpu = 2.21 billion requests per day
In summary, by combining Grafana K6 load testing tool with Grafana dashboards, developers can easily analyze Istio Ingress Gateway performance under high loads. The K6 tool allows for the generation of large volumes of traffic to stress-test the gateway, while the Grafana dashboards provide detailed insights into metrics like request rates, response times, and error rates.
Using this approach, Istio operators can identify bottlenecks, ensure high availability, and optimize configurations in order to handle increased traffic demands as adoption of the service mesh grows within an organization. With the ability to simulate real user scenarios at scale, developers gain valuable insights to build and operate a robust Istio infrastructure.
A single replica of Istio Ingress Gateway is good enough for many production-grade applications, and combining it with an automated horizontal scaling of the gateway will make it real a solid solution for most applications.
However, to have high availability in addition to a good performance, a multicluster approach is recommended, as a cluster-wide failure can make a lot of harm to your business if you rely on a single-cluster approach.
To learn how you can do this, check out this step by step video:


%20For%20More%20Dependable%20Humans.png)